Capital One 2012 Annual Report Download - page 139
Download and view the complete annual report
Please find page 139 of the 2012 Capital One annual report below. You can navigate through the pages in the report by either clicking on the pages listed below, or by using the keyword search tool below to find specific information within the annual report.-
 1
1 -
2
-
3
-
4
-
5
-
6
-
7
-
8
-
9
-
10
-
11
-
12
-
13
-
14
-
15
-
16
-
17
-
18
-
19
-
20
-
21
-
22
-
23
-
24
-
25
-
26
-
27
-
28
-
29
-
30
-
31
-
32
-
33
-
34
-
35
-
36
-
37
-
38
-
39
-
40
-
41
-
42
-
43
-
44
-
45
-
46
-
47
-
48
-
49
-
50
-
51
-
52
-
53
-
54
-
55
-
56
-
57
-
58
-
59
-
60
-
61
-
62
-
63
-
64
-
65
-
66
-
67
-
68
-
69
-
70
-
71
-
72
-
73
-
74
-
75
-
76
-
77
-
78
-
79
-
80
-
81
-
82
-
83
-
84
-
85
-
86
-
87
-
88
-
89
-
90
-
91
-
92
-
93
-
94
-
95
-
96
-
97
-
98
-
99
-
100
-
101
-
102
-
103
-
104
-
105
-
106
-
107
-
108
-
109
-
110
-
111
-
112
-
113
-
114
-
115
-
116
-
117
-
118
-
119
-
120
-
121
-
122
-
123
-
124
-
125
-
126
-
127
-
128
-
 129
129 -
 130
130 -
 131
131 -
 132
132 -
 133
133 -
 134
134 -
 135
135 -
 136
136 -
 137
137 -
 138
138 -
 139
139 -
 140
140 -
 141
141 -
 142
142 -
 143
143 -
 144
144 -
 145
145 -
 146
146 -
 147
147 -
 148
148 -
 149
149 -
150
-
151
-
152
-
153
-
154
-
155
-
156
-
157
-
158
-
159
-
160
-
161
-
162
-
163
-
164
-
165
-
166
-
167
-
168
-
169
-
170
-
171
-
172
-
173
-
174
-
175
-
176
-
177
-
178
-
179
-
180
-
181
-
182
-
183
-
184
-
185
-
186
-
187
-
188
-
189
-
190
-
191
-
192
-
193
-
194
-
195
-
196
-
197
-
198
-
199
-
200
-
201
-
202
-
203
-
204
-
205
-
206
-
207
-
208
-
209
-
210
-
211
-
212
-
213
-
214
-
215
-
216
-
217
-
218
-
219
-
220
-
221
-
222
-
223
-
224
-
225
-
226
-
227
-
228
-
229
-
230
-
231
-
232
-
233
-
234
-
235
-
236
-
237
-
238
-
239
-
240
-
241
-
242
-
243
-
244
-
245
-
246
-
247
-
248
-
249
-
250
-
251
-
252
-
253
-
254
-
255
-
256
-
257
-
258
-
259
-
260
-
261
-
262
-
263
-
264
-
265
-
266
-
267
-
268
-
269
-
270
-
271
-
272
-
273
-
274
-
275
-
276
-
277
-
278
-
279
-
280
-
281
-
282
-
283
-
284
-
285
-
286
-
287
-
288
-
289
-
290
-
291
-
292
-
293
-
294
-
295
-
296
-
297
-
298
-
299
-
300
-
301
-
302
-
303
-
304
-
305
-
306
-
307
-
308
-
309
-
310
-
311
 |
 |

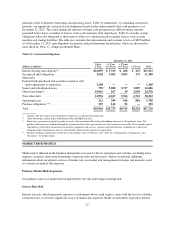
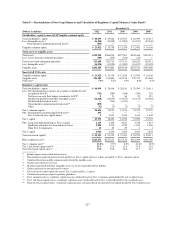
Table 32: Interest Rate Sensitivity Analysis
December 31, 2011
(Dollars in millions)
December 31,
2012
Excluding ING
Direct Swaps(1)
Including ING
Direct Swaps
Previous methodology:
Impact on adjusted projected base-line net interest income:
+ 200 basis points .................................... 1.3% 1.2% 13.7%
-50 basis points ...................................... (0.9) (0.5) (3.9)
Impact on economic value of equity:
+ 200 basis points .................................... (3.1) (1.0) 3.2
-50 basis points ...................................... (1.4) (0.4) (1.5)
Revised methodology:
Impact on adjusted projected base-line net interest income:
+ 200 basis points .................................... 2.7% NA NA
-50 basis points ...................................... (1.7) NA NA
Impact on economic value of equity:
+ 200 basis points .................................... (3.1) (1.0) 3.2
-50 basis points ...................................... (1.4) (0.4) (1.5)
NA Comparable information for December 31, 2011 is not available.
(1) Calculated excluding the impact of the interest rate swap transactions of approximately $24.8 billion entered into to mitigate some of the
interest rate risk related to the ING Direct acquisition.
Because of the large but temporary impact of the ING Direct-related swap transactions on our standard interest
rate risk reporting measures, we expanded our standard interest rate sensitivity analysis to present our interest
rate risk measures as of December 31, 2011 both with and without the impact of the $24.8 billion of interest rate
swaps described above. This presentation highlights changes in our core interest rate risk profile and the
incremental impact of the ING Direct-related swaps on our core profile over the time period that the swaps
remained outstanding. Excluding the $24.8 billion swap transactions, our interest rate sensitivity measures reflect
that we became modestly more asset sensitive between December 31, 2011 and December 31, 2012. Our
projected net interest income and economic value of equity sensitivity measures, both including and excluding
the impact of the ING Direct related swap transactions, were within our prescribed asset/liability policy limits as
of December 31, 2012 and 2011. Additionally, the new earnings sensitivity method results in a slightly higher
asset sensitivity position compared to the previous method, resulting from a higher forecasted volume of rate
sensitive assets versus rate sensitive liabilities in addition to the impact of an instantaneous rate shock.
Limitations of Market Risk Measures
The interest rate risk models that we use in deriving these measures incorporate contractual information,
internally-developed assumptions and proprietary modeling methodologies, which project borrower and deposit
behavior patterns in certain interest rate environments. Other market inputs, such as interest rates, market prices
and interest rate volatility, are also critical components of our interest rate risk measures. We regularly evaluate,
update and enhance these assumptions, models and analytical tools as we believe appropriate to reflect our best
assessment of the market environment and the expected behavior patterns of our existing assets and liabilities.
There are inherent limitations in any methodology used to estimate the exposure to changes in market interest
rates. The above sensitivity analyses contemplate only certain movements in interest rates and are performed at a
particular point in time based on the existing balance sheet and, in some cases, expected future business growth
and funding mix assumptions. The strategic actions that management may take to manage our balance sheet may
differ from our projections, which could cause our actual earnings and economic value of equity sensitivities to
differ from the above sensitivity analyses.
120