Capital One 2012 Annual Report Download - page 62
Download and view the complete annual report
Please find page 62 of the 2012 Capital One annual report below. You can navigate through the pages in the report by either clicking on the pages listed below, or by using the keyword search tool below to find specific information within the annual report.-
 1
1 -
2
-
3
-
4
-
5
-
6
-
7
-
8
-
9
-
10
-
11
-
12
-
13
-
14
-
15
-
16
-
17
-
18
-
19
-
20
-
21
-
22
-
23
-
24
-
25
-
26
-
27
-
28
-
29
-
30
-
31
-
32
-
33
-
34
-
35
-
36
-
37
-
38
-
39
-
40
-
41
-
42
-
43
-
44
-
45
-
46
-
47
-
48
-
49
-
50
-
51
-
 52
52 -
 53
53 -
 54
54 -
 55
55 -
 56
56 -
 57
57 -
 58
58 -
 59
59 -
 60
60 -
 61
61 -
 62
62 -
 63
63 -
 64
64 -
 65
65 -
 66
66 -
 67
67 -
 68
68 -
 69
69 -
 70
70 -
 71
71 -
 72
72 -
73
-
74
-
75
-
76
-
77
-
78
-
79
-
80
-
81
-
82
-
83
-
84
-
85
-
86
-
87
-
88
-
89
-
90
-
91
-
92
-
93
-
94
-
95
-
96
-
97
-
98
-
99
-
100
-
101
-
102
-
103
-
104
-
105
-
106
-
107
-
108
-
109
-
110
-
111
-
112
-
113
-
114
-
115
-
116
-
117
-
118
-
119
-
120
-
121
-
122
-
123
-
124
-
125
-
126
-
127
-
128
-
129
-
130
-
131
-
132
-
133
-
134
-
135
-
136
-
137
-
138
-
139
-
140
-
141
-
142
-
143
-
144
-
145
-
146
-
147
-
148
-
149
-
150
-
151
-
152
-
153
-
154
-
155
-
156
-
157
-
158
-
159
-
160
-
161
-
162
-
163
-
164
-
165
-
166
-
167
-
168
-
169
-
170
-
171
-
172
-
173
-
174
-
175
-
176
-
177
-
178
-
179
-
180
-
181
-
182
-
183
-
184
-
185
-
186
-
187
-
188
-
189
-
190
-
191
-
192
-
193
-
194
-
195
-
196
-
197
-
198
-
199
-
200
-
201
-
202
-
203
-
204
-
205
-
206
-
207
-
208
-
209
-
210
-
211
-
212
-
213
-
214
-
215
-
216
-
217
-
218
-
219
-
220
-
221
-
222
-
223
-
224
-
225
-
226
-
227
-
228
-
229
-
230
-
231
-
232
-
233
-
234
-
235
-
236
-
237
-
238
-
239
-
240
-
241
-
242
-
243
-
244
-
245
-
246
-
247
-
248
-
249
-
250
-
251
-
252
-
253
-
254
-
255
-
256
-
257
-
258
-
259
-
260
-
261
-
262
-
263
-
264
-
265
-
266
-
267
-
268
-
269
-
270
-
271
-
272
-
273
-
274
-
275
-
276
-
277
-
278
-
279
-
280
-
281
-
282
-
283
-
284
-
285
-
286
-
287
-
288
-
289
-
290
-
291
-
292
-
293
-
294
-
295
-
296
-
297
-
298
-
299
-
300
-
301
-
302
-
303
-
304
-
305
-
306
-
307
-
308
-
309
-
310
-
311
 |
 |

merchant interchange fees with respect to certain credit card transactions. Our expenses primarily consist of the
provision for credit losses, operating expenses (including associate salaries and benefits, occupancy and
equipment costs, professional services, infrastructure enhancements and branch operations and expansion costs),
marketing expenses and income taxes.
Our principal operations are currently organized for management reporting purposes into three primary business
segments, which are defined primarily based on the products and services provided or the type of customer
served: Credit Card, Consumer Banking and Commercial Banking. The operations of acquired businesses have
been integrated into our existing business segments. The acquired ING Direct business is primarily reflected in
our Consumer Banking business, while the business acquired in the 2012 U.S. card acquisition is reflected in our
Credit Card business. Certain activities that are not part of a segment are included in our “Other” category.
•Credit Card: Consists of our domestic consumer and small business card lending, national small business
lending, national closed end installment lending and the international card lending businesses in Canada and
the United Kingdom.
•Consumer Banking: Consists of our branch-based lending and deposit gathering activities for consumers and
small businesses, national deposit gathering, national auto lending and consumer home loan lending and
servicing activities.
•Commercial Banking: Consists of our lending, deposit gathering and treasury management services to
commercial real estate and commercial and industrial customers. Our commercial and industrial customers
typically include companies with annual revenues between $10 million to $1.0 billion.
In the first quarter of 2012, we re-aligned the loan categories reported by our Commercial Banking business and
the loan customer and product types included within each category. Prior period amounts have been recast to
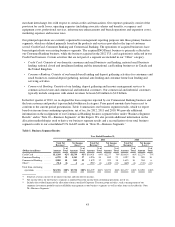
conform to the current period presentation. Table 1 summarizes our business segment results, which we report
based on income from continuing operations, net of tax, for 2012, 2011 and 2010. We provide additional
information on the realignment of our Commercial Banking business segment below under “Business Segment
Results” and in “Note 20—Business Segments” of this Report. We also provide additional information on the
allocation methodologies used to derive our business segment results and a reconciliation of our total business
segment results to our consolidated U.S. GAAP results in “Note 20—Business Segments.”
Table 1: Business Segment Results
Year Ended December 31,
2012 2011 2010
Total Net
Revenue(1)
Net Income
(Loss)(2)
Total Net
Revenue(1)
Net Income
(Loss)(2)
Total Net
Revenue(1)
Net Income
(Loss)(2)
(Dollars in millions) Amount
% of
Total Amount
% of
Total Amount
% of
Total Amount
% of
Total Amount
% of
Total Amount
% of
Total
Credit Card ............... $13,260 62% $1,530 41% $10,431 64% $2,277 70% $10,614 66% $2,274 75%
Consumer Banking ......... 6,570 30 1,363 37 4,956 30 809 25 4,597 28 905 30
Commercial Banking ........ 2,080 10 835 22 1,879 12 595 18 1,635 10 204 6
Other(3) .................. (514) (2) 6 — (987) (6) (428) (13) (669) (4) (333) (11)
Total from continuing
operations .............. $21,396 100% $3,734 100% $16,279 100% $3,253 100% $16,177 100% $3,050 100%
(1) Total net revenue consists of net interest income and non-interest income.
(2) Net income (loss) for our business segments is reported based on income from continuing operations, net of tax.
(3) Includes the residual impact of the allocation of our centralized Corporate Treasury group activities, such as management of our
corporate investment portfolio and asset/liability management, to our business segments as well as other items as described in “Note
20—Business Segments.”
43