Capital One 2012 Annual Report Download - page 214
Download and view the complete annual report
Please find page 214 of the 2012 Capital One annual report below. You can navigate through the pages in the report by either clicking on the pages listed below, or by using the keyword search tool below to find specific information within the annual report.-
 1
1 -
2
-
3
-
4
-
5
-
6
-
7
-
8
-
9
-
10
-
11
-
12
-
13
-
14
-
15
-
16
-
17
-
18
-
19
-
20
-
21
-
22
-
23
-
24
-
25
-
26
-
27
-
28
-
29
-
30
-
31
-
32
-
33
-
34
-
35
-
36
-
37
-
38
-
39
-
40
-
41
-
42
-
43
-
44
-
45
-
46
-
47
-
48
-
49
-
50
-
51
-
52
-
53
-
54
-
55
-
56
-
57
-
58
-
59
-
60
-
61
-
62
-
63
-
64
-
65
-
66
-
67
-
68
-
69
-
70
-
71
-
72
-
73
-
74
-
75
-
76
-
77
-
78
-
79
-
80
-
81
-
82
-
83
-
84
-
85
-
86
-
87
-
88
-
89
-
90
-
91
-
92
-
93
-
94
-
95
-
96
-
97
-
98
-
99
-
100
-
101
-
102
-
103
-
104
-
105
-
106
-
107
-
108
-
109
-
110
-
111
-
112
-
113
-
114
-
115
-
116
-
117
-
118
-
119
-
120
-
121
-
122
-
123
-
124
-
125
-
126
-
127
-
128
-
129
-
130
-
131
-
132
-
133
-
134
-
135
-
136
-
137
-
138
-
139
-
140
-
141
-
142
-
143
-
144
-
145
-
146
-
147
-
148
-
149
-
150
-
151
-
152
-
153
-
154
-
155
-
156
-
157
-
158
-
159
-
160
-
161
-
162
-
163
-
164
-
165
-
166
-
167
-
168
-
169
-
170
-
171
-
172
-
173
-
174
-
175
-
176
-
177
-
178
-
179
-
180
-
181
-
182
-
183
-
184
-
185
-
186
-
187
-
188
-
189
-
190
-
191
-
192
-
193
-
194
-
195
-
196
-
197
-
198
-
199
-
200
-
201
-
202
-
203
-
 204
204 -
 205
205 -
 206
206 -
 207
207 -
 208
208 -
 209
209 -
 210
210 -
 211
211 -
 212
212 -
 213
213 -
 214
214 -
 215
215 -
 216
216 -
 217
217 -
 218
218 -
 219
219 -
 220
220 -
 221
221 -
 222
222 -
 223
223 -
 224
224 -
225
-
226
-
227
-
228
-
229
-
230
-
231
-
232
-
233
-
234
-
235
-
236
-
237
-
238
-
239
-
240
-
241
-
242
-
243
-
244
-
245
-
246
-
247
-
248
-
249
-
250
-
251
-
252
-
253
-
254
-
255
-
256
-
257
-
258
-
259
-
260
-
261
-
262
-
263
-
264
-
265
-
266
-
267
-
268
-
269
-
270
-
271
-
272
-
273
-
274
-
275
-
276
-
277
-
278
-
279
-
280
-
281
-
282
-
283
-
284
-
285
-
286
-
287
-
288
-
289
-
290
-
291
-
292
-
293
-
294
-
295
-
296
-
297
-
298
-
299
-
300
-
301
-
302
-
303
-
304
-
305
-
306
-
307
-
308
-
309
-
310
-
311
 |
 |

CAPITAL ONE FINANCIAL CORPORATION
NOTES TO CONSOLIDATED FINANCIAL STATEMENTS—(Continued)
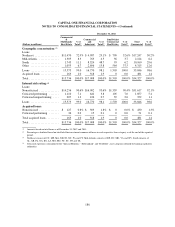
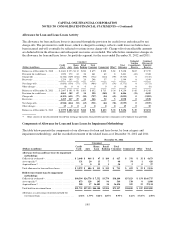
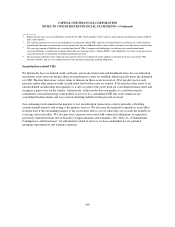
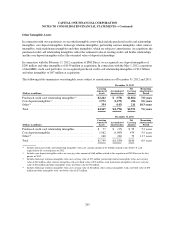
Allowance for Loan and Lease Losses Activity
The allowance for loan and lease losses is increased through the provision for credit losses and reduced by net
charge-offs. The provision for credit losses, which is charged to earnings, reflects credit losses we believe have
been incurred and will eventually be reflected over time in our charge-offs. Charge-offs of uncollectible amounts
are deducted from the allowance and subsequent recoveries are included. The table below summarizes changes in
the allowance for loan and lease losses, by portfolio segment, for the years ended December 31, 2012 and 2011:
Consumer Unfunded
Lending
Commitments
Reserve
Combined
Allowance &
Unfunded
Reserve(Dollars in millions)
Credit
Card Auto
Home
Loan
Retail
Banking
Total
Consumer Commercial Other(1)
Total
Allowance
Balance as of December 31, 2010 . . . $ 4,041 $ 353 $ 112 $210 $ 675 $ 830 $ 82 $ 5,628 $107 $ 5,735
Provision for credit losses .......... 1,870 372 63 26 461 62 8 2,401 (41) 2,360
Charge-offs ..................... (4,310) (529) (104) (99) (732) (214) (59) (5,315) 0 (5,315)
Recoveries ...................... 1,254 195 27 26 248 37 5 1,544 0 1,544
Net charge-offs .................. (3,056) (334) (77) (73) (484) (177) (54) (3,771) 0 (3,771)
Other changes ................... (8) 0 0 0 0 0 0 (8) 0 (8)
Balance as of December 31, 2011 . . . $ 2,847 $ 391 $ 98 $163 $ 652 $ 715 $ 36 $ 4,250 $ 66 $ 4,316
Provision for credit losses .......... 4,061 509 67 14 590 (240) 35 4,446 (31) 4,415
Charge-offs ..................... (4,159) (631) (77) (89) (797) (94) (43) (5,093) 0 (5,093)
Recoveries ...................... 1,215 217 25 24 266 52 5 1,538 0 1,538
Net charge-offs .................. (2,944) (414) (52) (65) (531) (42) (38) (3,555) 0 (3,555)
Other changes ................... 15 0 0 0 0 0 0 15 0 15
Balance as of December 31, 2012 . . . $ 3,979 $ 486 $ 113 $112 $ 711 $ 433 $ 33 $ 5,156 $ 35 $ 5,191
(1) Other consists of our discontinued GreenPoint mortgage operations loan portfolio and our community redevelopment loan portfolio.
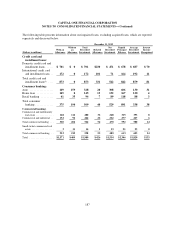
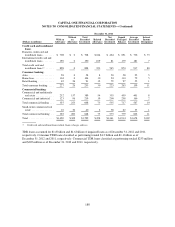
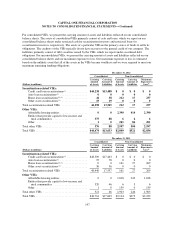
Components of Allowance for Loan and Lease Losses by Impairment Methodology
The table below presents the components of our allowance for loan and lease losses, by loan category and
impairment methodology, and the recorded investment of the related loans as of December 31, 2012 and 2011:
December 31, 2012
Consumer
(Dollars in millions)
Credit
Card Auto
Home
Loan
Retail
Banking
Total
Consumer Commercial Other Total
Allowance for loan and lease losses by impairment
methodology:
Collectively evaluated(1) ......................... $ 3,648 $ 466 $ 47 $ 104 $ 617 $ 376 $ 32 $ 4,673
Asset-specific(2) ................................ 331 20 13 7 40 54 1 426
Acquired loans(3) ............................... 0 0 53 1 54 3 0 57
Total allowance for loan and lease losses ............ $ 3,979 $ 486 $ 113 $ 112 $ 711 $ 433 $ 33 $ 5,156
Held-for-investment loans by impairment
methodology:
Collectively evaluated(1) ......................... $90,594 $26,778 $ 7,552 $3,774 $38,104 $37,923 $ 154 $166,775
Asset-specific(2) ................................ 873 328 145 96 569 538 0 1,980
Acquired loans(3) ............................... 288 17 36,403 34 36,454 359 33 37,134
Total held-for-investment loans ................... $91,755 $27,123 $44,100 $3,904 $75,127 $38,820 $ 187 $205,889
Allowance as a percentage of period-end held-for-
investment loans ............................. 4.34% 1.79% 0.26% 2.87% 0.95% 1.12% 17.65% 2.50%
195