Capital One 2012 Annual Report Download - page 88
Download and view the complete annual report
Please find page 88 of the 2012 Capital One annual report below. You can navigate through the pages in the report by either clicking on the pages listed below, or by using the keyword search tool below to find specific information within the annual report.-
 1
1 -
2
-
3
-
4
-
5
-
6
-
7
-
8
-
9
-
10
-
11
-
12
-
13
-
14
-
15
-
16
-
17
-
18
-
19
-
20
-
21
-
22
-
23
-
24
-
25
-
26
-
27
-
28
-
29
-
30
-
31
-
32
-
33
-
34
-
35
-
36
-
37
-
38
-
39
-
40
-
41
-
42
-
43
-
44
-
45
-
46
-
47
-
48
-
49
-
50
-
51
-
52
-
53
-
54
-
55
-
56
-
57
-
58
-
59
-
60
-
61
-
62
-
63
-
64
-
65
-
66
-
67
-
68
-
69
-
70
-
71
-
72
-
73
-
74
-
75
-
76
-
77
-
 78
78 -
 79
79 -
 80
80 -
 81
81 -
 82
82 -
 83
83 -
 84
84 -
 85
85 -
 86
86 -
 87
87 -
 88
88 -
 89
89 -
 90
90 -
 91
91 -
 92
92 -
 93
93 -
 94
94 -
 95
95 -
 96
96 -
 97
97 -
 98
98 -
99
-
100
-
101
-
102
-
103
-
104
-
105
-
106
-
107
-
108
-
109
-
110
-
111
-
112
-
113
-
114
-
115
-
116
-
117
-
118
-
119
-
120
-
121
-
122
-
123
-
124
-
125
-
126
-
127
-
128
-
129
-
130
-
131
-
132
-
133
-
134
-
135
-
136
-
137
-
138
-
139
-
140
-
141
-
142
-
143
-
144
-
145
-
146
-
147
-
148
-
149
-
150
-
151
-
152
-
153
-
154
-
155
-
156
-
157
-
158
-
159
-
160
-
161
-
162
-
163
-
164
-
165
-
166
-
167
-
168
-
169
-
170
-
171
-
172
-
173
-
174
-
175
-
176
-
177
-
178
-
179
-
180
-
181
-
182
-
183
-
184
-
185
-
186
-
187
-
188
-
189
-
190
-
191
-
192
-
193
-
194
-
195
-
196
-
197
-
198
-
199
-
200
-
201
-
202
-
203
-
204
-
205
-
206
-
207
-
208
-
209
-
210
-
211
-
212
-
213
-
214
-
215
-
216
-
217
-
218
-
219
-
220
-
221
-
222
-
223
-
224
-
225
-
226
-
227
-
228
-
229
-
230
-
231
-
232
-
233
-
234
-
235
-
236
-
237
-
238
-
239
-
240
-
241
-
242
-
243
-
244
-
245
-
246
-
247
-
248
-
249
-
250
-
251
-
252
-
253
-
254
-
255
-
256
-
257
-
258
-
259
-
260
-
261
-
262
-
263
-
264
-
265
-
266
-
267
-
268
-
269
-
270
-
271
-
272
-
273
-
274
-
275
-
276
-
277
-
278
-
279
-
280
-
281
-
282
-
283
-
284
-
285
-
286
-
287
-
288
-
289
-
290
-
291
-
292
-
293
-
294
-
295
-
296
-
297
-
298
-
299
-
300
-
301
-
302
-
303
-
304
-
305
-
306
-
307
-
308
-
309
-
310
-
311
 |
 |
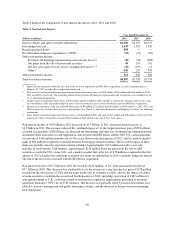
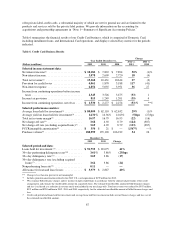
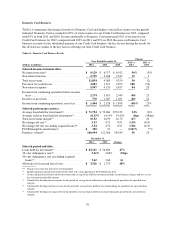
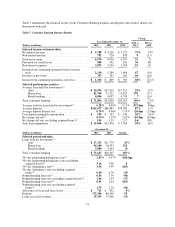
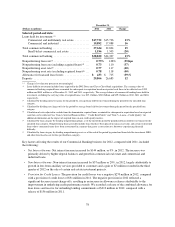
•Total Loans: Period-end loans in our Credit Card business increased by $26.7 billion, or 41%, in 2012, to
$91.8 billion as of December 31, 2012. The increase was primarily due to the addition of the $27.8 billion in
outstanding receivables acquired in the 2012 U.S. card acquisition classified as held for investment.
Excluding the addition of these receivables, period-end loans held for investment decreased by $1.1 billion,
or 2%, due to the expected continued run-off of our installment loan portfolio as well as the expected run-
off of higher-margin, higher-loss receivables acquired in the 2012 U.S. card acquisition.
•Charge-off and Delinquency Statistics: Our reported net charge-off rate decreased to 3.68% in 2012, from
4.92% in 2011. Our reported charge-offs reflect the absence of charge-offs for the receivables acquired in
the 2012 U.S. card acquisition accounted for based on estimated cash flows expected to be collected over
the life of the loans as the credit mark established at acquisition is expected to absorb uncollectible
contractual amounts. The decrease in the net-charge off rates was due in part to the addition of loans
acquired in the 2012 U.S. card acquisition to the denominator in calculating our reported charge-off rates
and the lag in the impact of charge-offs related to these loans, as described above under “Executive
Summary and Business Outlook.” The 30+ day delinquency rate decreased to 3.69% as of December 31,
2012, from 3.86% as of December 31, 2011.
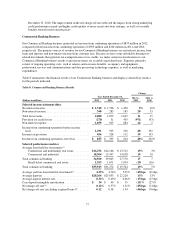
Key factors affecting the results of our Credit Card business for 2011, compared with 2010 included the
following:
•Net Interest Income: Net interest income decreased by $72 million, or 1%, in 2011, reflecting the impact of
a 1% decline in average loan balances. The expected run-off of the installment loan portfolio was the
primary driver of the decline in average loan balances in 2011, more than offsetting the increase from the
additions of the HBC and Kohl’s portfolios.
•Non-Interest Income: Non-interest income decreased by $111 million, or 4%, in 2011. The decrease reflects
the impact of contra-revenue amounts, including a provision of $102 million for anticipated refunds to U.K.
customers related to retrospective regulatory requirements pertaining to payment protection insurance
(“PPI”) in our U.K. business and the recognition of expenses related to the periodic adjustment of our
customer rewards points liability to reflect the estimated cost of points earned to date that are ultimately
expected to be redeemed. These decreases were partially offset by higher net interchange fees during 2011,
attributable to increased purchase volume.
•Provision for Credit Losses: The provision for credit losses related to our Credit Card business decreased by
$1.3 billion in 2011, to $1.9 billion. The decrease was primarily attributable to a continued improvement in
credit performance, including reduced delinquency rates, lower bankruptcy losses and a significant decrease
in charge-offs. Net charge-offs declined by $2.4 billion to $3.1 billion in 2011, from $5.5 billion in 2010,
which, as indicated below, resulted in a decrease in the net charge-off rate to 4.92% in 2011, from 8.79% in
2010.
•Non-Interest Expense: Non-interest expense increased by $1.1 billion, or 27%, in 2011. The increase was
attributable to increased marketing expenditures as we expanded our marketing efforts to drive new business
volume through a variety of channels, higher legal expenses and increased operating costs. In addition, we
recorded expense of $40 million in relation to regulatory requirements pertaining to PPI in our U.K.
business.
•Total Loans: Period-end loans in our Credit Card business increased by $3.7 billion, or 6%, in 2011, to
$65.1 billion as of December 31, 2011. The increase was primarily attributable to the acquisitions of the
Kohl’s credit card portfolio of $3.7 billion and the HBC credit card portfolio of $1.4 billion, which were
partially offset by the continued run-off of the installment loan portfolio.
•Charge-off and Delinquency Statistics: Net charge-off and delinquency rates continued to improve in 2011.
The net charge-off rate decreased to 4.92% in 2011, from 8.79% in 2010. The 30+ day delinquency rate
decreased to 3.86% as of December 31, 2011, from 4.29% as of December 31, 2010. The improvement in
the net charge-off and delinquency rates reflected the impact of improved credit quality across our credit
card portfolio, tighter underwriting standards implemented over the last several years and ongoing
normalization of credit performance in the portfolio.
69