Capital One 2012 Annual Report Download - page 195
Download and view the complete annual report
Please find page 195 of the 2012 Capital One annual report below. You can navigate through the pages in the report by either clicking on the pages listed below, or by using the keyword search tool below to find specific information within the annual report.-
 1
1 -
2
-
3
-
4
-
5
-
6
-
7
-
8
-
9
-
10
-
11
-
12
-
13
-
14
-
15
-
16
-
17
-
18
-
19
-
20
-
21
-
22
-
23
-
24
-
25
-
26
-
27
-
28
-
29
-
30
-
31
-
32
-
33
-
34
-
35
-
36
-
37
-
38
-
39
-
40
-
41
-
42
-
43
-
44
-
45
-
46
-
47
-
48
-
49
-
50
-
51
-
52
-
53
-
54
-
55
-
56
-
57
-
58
-
59
-
60
-
61
-
62
-
63
-
64
-
65
-
66
-
67
-
68
-
69
-
70
-
71
-
72
-
73
-
74
-
75
-
76
-
77
-
78
-
79
-
80
-
81
-
82
-
83
-
84
-
85
-
86
-
87
-
88
-
89
-
90
-
91
-
92
-
93
-
94
-
95
-
96
-
97
-
98
-
99
-
100
-
101
-
102
-
103
-
104
-
105
-
106
-
107
-
108
-
109
-
110
-
111
-
112
-
113
-
114
-
115
-
116
-
117
-
118
-
119
-
120
-
121
-
122
-
123
-
124
-
125
-
126
-
127
-
128
-
129
-
130
-
131
-
132
-
133
-
134
-
135
-
136
-
137
-
138
-
139
-
140
-
141
-
142
-
143
-
144
-
145
-
146
-
147
-
148
-
149
-
150
-
151
-
152
-
153
-
154
-
155
-
156
-
157
-
158
-
159
-
160
-
161
-
162
-
163
-
164
-
165
-
166
-
167
-
168
-
169
-
170
-
171
-
172
-
173
-
174
-
175
-
176
-
177
-
178
-
179
-
180
-
181
-
182
-
183
-
184
-
 185
185 -
 186
186 -
 187
187 -
 188
188 -
 189
189 -
 190
190 -
 191
191 -
 192
192 -
 193
193 -
 194
194 -
 195
195 -
 196
196 -
 197
197 -
 198
198 -
 199
199 -
 200
200 -
 201
201 -
 202
202 -
 203
203 -
 204
204 -
 205
205 -
206
-
207
-
208
-
209
-
210
-
211
-
212
-
213
-
214
-
215
-
216
-
217
-
218
-
219
-
220
-
221
-
222
-
223
-
224
-
225
-
226
-
227
-
228
-
229
-
230
-
231
-
232
-
233
-
234
-
235
-
236
-
237
-
238
-
239
-
240
-
241
-
242
-
243
-
244
-
245
-
246
-
247
-
248
-
249
-
250
-
251
-
252
-
253
-
254
-
255
-
256
-
257
-
258
-
259
-
260
-
261
-
262
-
263
-
264
-
265
-
266
-
267
-
268
-
269
-
270
-
271
-
272
-
273
-
274
-
275
-
276
-
277
-
278
-
279
-
280
-
281
-
282
-
283
-
284
-
285
-
286
-
287
-
288
-
289
-
290
-
291
-
292
-
293
-
294
-
295
-
296
-
297
-
298
-
299
-
300
-
301
-
302
-
303
-
304
-
305
-
306
-
307
-
308
-
309
-
310
-
311
 |
 |

CAPITAL ONE FINANCIAL CORPORATION
NOTES TO CONSOLIDATED FINANCIAL STATEMENTS—(Continued)
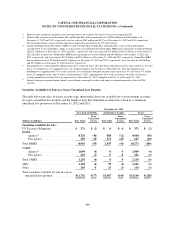
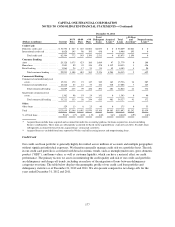
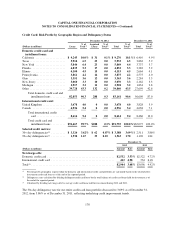
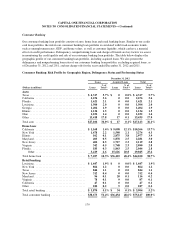
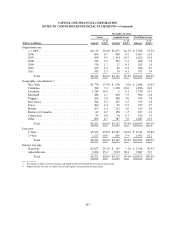
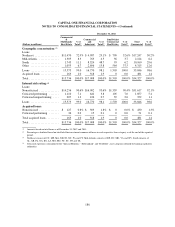
The following table summarizes the payment status of loans in our total loan portfolio, including an aging of
delinquent loans, loans 90 days or more past due continuing to accrue interest and loans classified as
nonperforming. We present the information below on the credit performance of our loan portfolio, by major loan
category, including key metrics that we use in tracking changes in the credit quality of each of our loan
portfolios. The delinquency aging includes all past due loans, both performing and nonperforming, as of
December 31, 2012 and 2011.
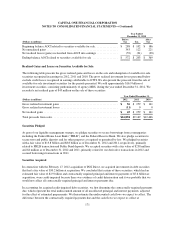
Loans 90 days or more past due totaled approximately $2.3 billion and $2.0 billion as of December 31, 2012 and
2011, respectively. Loans classified as nonperforming totaled $1.1 billion as of both December 31, 2012 and
2011, respectively.
December 31, 2012
(Dollars in millions) Current
30-59
Days
60-89
Days
> 90
Days
Total
Delinquent
Loans
Acquired
Loans(1)
Total
Loans
> 90 Days
and
Accruing(2)
Nonperforming
Loans(2)
Credit Card:
Domestic credit card .......... $ 79,852 $ 932 $ 659 $ 1,410 $ 3,001 $ 288 $ 83,141 $ 1,410 $ 0
International credit card ........ 8,227 145 89 153 387 0 8,614 100 100
Total credit card .......... 88,079 1,077 748 1,563 3,388 288 91,755 1,510 100
Consumer Banking:
Auto ....................... 25,057 1,341 559 149 2,049 17 27,123 0 149
Home loan .................. 7,317 63 29 288 380 36,403 44,100 0 422
Retail banking ............... 3,789 26 10 45 81 34 3,904 1 71
Total consumer banking .... 36,163 1,430 598 482 2,510 36,454 75,127 1 642
Commercial Banking:
Commercial and multifamily real
estate ..................... 17,357 64 77 107 248 127 17,732 2 137
Commercial and industrial ...... 19,525 57 3 75 135 232 19,892 14 133
Total commercial lending . . 36,882 121 80 182 383 359 37,624 16 270
Small-ticket commercial real
estate ..................... 1,153 28 9 6 43 0 1,196 0 12
Total commercial banking . . 38,035 149 89 188 426 359 38,820 16 282
Other:
Other loans .................. 118 8 5 23 36 33 187 0 30
Total ....................... $ 162,395 $ 2,664 $ 1,440 $ 2,256 $ 6,360 $ 37,134 $ 205,889 $ 1,527 $ 1,054
% of Total loans .............. 78.9% 1.3% 0.7% 1.1% 3.1% 18.0% 100.0% 0.7% 0.5%
176