Capital One 2012 Annual Report Download - page 82
Download and view the complete annual report
Please find page 82 of the 2012 Capital One annual report below. You can navigate through the pages in the report by either clicking on the pages listed below, or by using the keyword search tool below to find specific information within the annual report.-
 1
1 -
2
-
3
-
4
-
5
-
6
-
7
-
8
-
9
-
10
-
11
-
12
-
13
-
14
-
15
-
16
-
17
-
18
-
19
-
20
-
21
-
22
-
23
-
24
-
25
-
26
-
27
-
28
-
29
-
30
-
31
-
32
-
33
-
34
-
35
-
36
-
37
-
38
-
39
-
40
-
41
-
42
-
43
-
44
-
45
-
46
-
47
-
48
-
49
-
50
-
51
-
52
-
53
-
54
-
55
-
56
-
57
-
58
-
59
-
60
-
61
-
62
-
63
-
64
-
65
-
66
-
67
-
68
-
69
-
70
-
71
-
 72
72 -
 73
73 -
 74
74 -
 75
75 -
 76
76 -
 77
77 -
 78
78 -
 79
79 -
 80
80 -
 81
81 -
 82
82 -
 83
83 -
 84
84 -
 85
85 -
 86
86 -
 87
87 -
 88
88 -
 89
89 -
 90
90 -
 91
91 -
 92
92 -
93
-
94
-
95
-
96
-
97
-
98
-
99
-
100
-
101
-
102
-
103
-
104
-
105
-
106
-
107
-
108
-
109
-
110
-
111
-
112
-
113
-
114
-
115
-
116
-
117
-
118
-
119
-
120
-
121
-
122
-
123
-
124
-
125
-
126
-
127
-
128
-
129
-
130
-
131
-
132
-
133
-
134
-
135
-
136
-
137
-
138
-
139
-
140
-
141
-
142
-
143
-
144
-
145
-
146
-
147
-
148
-
149
-
150
-
151
-
152
-
153
-
154
-
155
-
156
-
157
-
158
-
159
-
160
-
161
-
162
-
163
-
164
-
165
-
166
-
167
-
168
-
169
-
170
-
171
-
172
-
173
-
174
-
175
-
176
-
177
-
178
-
179
-
180
-
181
-
182
-
183
-
184
-
185
-
186
-
187
-
188
-
189
-
190
-
191
-
192
-
193
-
194
-
195
-
196
-
197
-
198
-
199
-
200
-
201
-
202
-
203
-
204
-
205
-
206
-
207
-
208
-
209
-
210
-
211
-
212
-
213
-
214
-
215
-
216
-
217
-
218
-
219
-
220
-
221
-
222
-
223
-
224
-
225
-
226
-
227
-
228
-
229
-
230
-
231
-
232
-
233
-
234
-
235
-
236
-
237
-
238
-
239
-
240
-
241
-
242
-
243
-
244
-
245
-
246
-
247
-
248
-
249
-
250
-
251
-
252
-
253
-
254
-
255
-
256
-
257
-
258
-
259
-
260
-
261
-
262
-
263
-
264
-
265
-
266
-
267
-
268
-
269
-
270
-
271
-
272
-
273
-
274
-
275
-
276
-
277
-
278
-
279
-
280
-
281
-
282
-
283
-
284
-
285
-
286
-
287
-
288
-
289
-
290
-
291
-
292
-
293
-
294
-
295
-
296
-
297
-
298
-
299
-
300
-
301
-
302
-
303
-
304
-
305
-
306
-
307
-
308
-
309
-
310
-
311
 |
 |
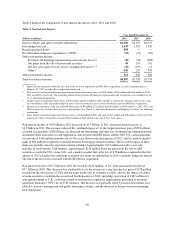
We recorded net OTTI losses of $52 million, $21 million and $65 million in 2012, 2011, and 2010, respectively.
These OTTI losses resulted from the deterioration in the credit quality of certain non-agency mortgage-backed
securities due to the prolonged weakness in the housing market and fragile economic recovery. We provide
additional information on other-than-temporary impairment recognized on our available-for-sale securities in
“Note 4—Investment Securities.”
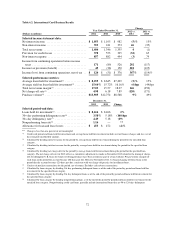
Provision for Credit Losses
We build our allowance for loan and lease losses and unfunded lending commitment reserves through the
provision for credit losses. Our provision for credit losses in each period is driven by charge-offs and the level of
allowance for loan and lease losses that we determine is necessary to provide for probable loan and lease losses
incurred that are inherent in our loan portfolio as of each balance sheet date. We recorded a provision for credit
losses of $4.4 billion in 2012, compared with $2.4 billion in 2011 and $3.9 billion in 2010. The provision for
credit losses as a percentage of net interest income was 26.6%, 18.5% and 31.4% in 2012, 2011 and 2010,
respectively.
The increase in the provision for credit losses of $2.0 billion in 2012 from 2011 was primarily related to the
addition of the $26.2 billion in outstanding receivables acquired in the 2012 U.S. card acquisition designated as
held for investment that had existing revolving privileges at acquisition. These loans were recorded at a fair value
of $26.9 billion, resulting in a net premium of $705 million at acquisition. Fair value was determined by
discounting all expected cash flows (contractual principal, interest, finance charges and fees of $33.3 billion less
those amounts not expected to be collected of $3.0 billion) at a market discount rate.
Under applicable accounting guidance, we are required to amortize the net premium of $705 million over the
contractual principal amount as an adjustment to interest income over the remaining life of the loans. Given the
guidance applicable to revolving loans, it is necessary to record an allowance through provision for credit losses
to properly recognize an estimate of incurred losses on the existing principal balances, which represents a portion
of the total amounts not expected to be collected described above. In the second quarter of 2012, we recorded a
provision for credit losses of $1.2 billion to establish an initial allowance primarily related to these loans. The
allowance was calculated using the same methodology utilized for determining the allowance for our existing
credit card loan portfolio. The provision for credit losses, excluding the initial allowance build of $1.2 billion
related to the 2012 U.S. card acquisition, was $3.2 billion in 2012. The increase in the provision for credit losses,
excluding the impact of the initial allowance build related to the 2012 U.S. card acquisition, was largely
attributable to the growth in auto and commercial loan originations, coupled with the absence of the allowance
release for our Credit Card business recorded in 2011.
The decrease in the provision for credit losses of $1.5 billion in 2011 from 2010 was largely driven by a
substantial decline in net charge-offs across all of our business segments, reflecting a continued improvement in
the credit performance of our loan portfolio.
On October 29, 2012, Hurricane Sandy made landfall on the New Jersey coast, resulting in severe disaster in
coastal counties in Connecticut, New Jersey and New York and varying degrees of damage and disruption in
other Northeast and Mid-Atlantic states. Because we have significant consumer and commercial loan exposure in
Connecticut, New Jersey and New York, the storm and its aftermath resulted in an elevated risk of loss for us
within this region. Based on our assessment of the impact of Hurricane Sandy on our loan portfolio, we recorded
an allowance of $39 million as of December 31, 2012, which is included in our total allowance for loan and lease
losses of $5.2 billion as of December 31, 2012.
We provide additional information on the provision for credit losses and changes in the allowance for loan and
lease losses under the “Credit Risk Profile—Summary of Allowance for Loan and Lease Losses” and “Note 6—
Allowance for Loan and Lease Losses.” For information on our allowance methodology, see “Note 1—Summary
of Significant Accounting Policies.”
63