Capital One 2012 Annual Report Download - page 225
Download and view the complete annual report
Please find page 225 of the 2012 Capital One annual report below. You can navigate through the pages in the report by either clicking on the pages listed below, or by using the keyword search tool below to find specific information within the annual report.-
 1
1 -
2
-
3
-
4
-
5
-
6
-
7
-
8
-
9
-
10
-
11
-
12
-
13
-
14
-
15
-
16
-
17
-
18
-
19
-
20
-
21
-
22
-
23
-
24
-
25
-
26
-
27
-
28
-
29
-
30
-
31
-
32
-
33
-
34
-
35
-
36
-
37
-
38
-
39
-
40
-
41
-
42
-
43
-
44
-
45
-
46
-
47
-
48
-
49
-
50
-
51
-
52
-
53
-
54
-
55
-
56
-
57
-
58
-
59
-
60
-
61
-
62
-
63
-
64
-
65
-
66
-
67
-
68
-
69
-
70
-
71
-
72
-
73
-
74
-
75
-
76
-
77
-
78
-
79
-
80
-
81
-
82
-
83
-
84
-
85
-
86
-
87
-
88
-
89
-
90
-
91
-
92
-
93
-
94
-
95
-
96
-
97
-
98
-
99
-
100
-
101
-
102
-
103
-
104
-
105
-
106
-
107
-
108
-
109
-
110
-
111
-
112
-
113
-
114
-
115
-
116
-
117
-
118
-
119
-
120
-
121
-
122
-
123
-
124
-
125
-
126
-
127
-
128
-
129
-
130
-
131
-
132
-
133
-
134
-
135
-
136
-
137
-
138
-
139
-
140
-
141
-
142
-
143
-
144
-
145
-
146
-
147
-
148
-
149
-
150
-
151
-
152
-
153
-
154
-
155
-
156
-
157
-
158
-
159
-
160
-
161
-
162
-
163
-
164
-
165
-
166
-
167
-
168
-
169
-
170
-
171
-
172
-
173
-
174
-
175
-
176
-
177
-
178
-
179
-
180
-
181
-
182
-
183
-
184
-
185
-
186
-
187
-
188
-
189
-
190
-
191
-
192
-
193
-
194
-
195
-
196
-
197
-
198
-
199
-
200
-
201
-
202
-
203
-
204
-
205
-
206
-
207
-
208
-
209
-
210
-
211
-
212
-
213
-
214
-
 215
215 -
 216
216 -
 217
217 -
 218
218 -
 219
219 -
 220
220 -
 221
221 -
 222
222 -
 223
223 -
 224
224 -
 225
225 -
 226
226 -
 227
227 -
 228
228 -
 229
229 -
 230
230 -
 231
231 -
 232
232 -
 233
233 -
 234
234 -
 235
235 -
236
-
237
-
238
-
239
-
240
-
241
-
242
-
243
-
244
-
245
-
246
-
247
-
248
-
249
-
250
-
251
-
252
-
253
-
254
-
255
-
256
-
257
-
258
-
259
-
260
-
261
-
262
-
263
-
264
-
265
-
266
-
267
-
268
-
269
-
270
-
271
-
272
-
273
-
274
-
275
-
276
-
277
-
278
-
279
-
280
-
281
-
282
-
283
-
284
-
285
-
286
-
287
-
288
-
289
-
290
-
291
-
292
-
293
-
294
-
295
-
296
-
297
-
298
-
299
-
300
-
301
-
302
-
303
-
304
-
305
-
306
-
307
-
308
-
309
-
310
-
311
 |
 |

CAPITAL ONE FINANCIAL CORPORATION
NOTES TO CONSOLIDATED FINANCIAL STATEMENTS—(Continued)
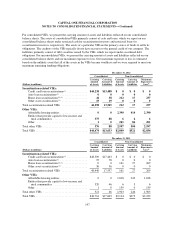
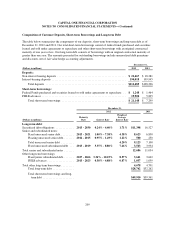
Intangible assets, which are reported in other assets on our consolidated balance sheets, are amortized over their
respective estimated useful lives on either a straight-line or an accelerated basis. The following table summarizes
the actual amortization expense recorded for the years ended December 31, 2012, 2011, and 2010 and the
estimated future amortization expense for intangible assets as of December 31, 2012:
(Dollars in millions)
Amortization
Expense
Actual for the year ended December 31,
2010 ............................................................................ $ 220
2011 ............................................................................ 222
2012 ............................................................................ 609
Estimated future amounts for the year ended December 31,
2013 ............................................................................ $ 682
2014 ............................................................................ 554
2015 ............................................................................ 444
2016 ............................................................................ 341
2017 ............................................................................ 241
Thereafter ....................................................................... 309
Total estimated future amounts ....................................................... $2,571
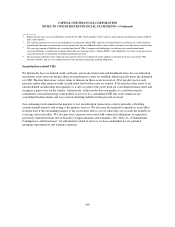
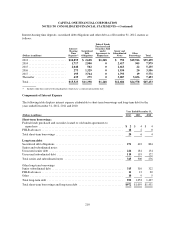
NOTE 9—PREMISES, EQUIPMENT & LEASE COMMITMENTS
Premises and Equipment
Premises and equipment at December 31, 2012 and 2011 were as follows:
December 31,
(Dollars in millions) 2012 2011
Land ...................................................................... $ 580 $ 549
Buildings and improvements ................................................... 2,341 2,018
Furniture and equipment ....................................................... 1,589 1,355
Computer software ........................................................... 1,563 932
In process .................................................................. 420 373
6,493 5,227
Less: Accumulated depreciation and amortization ................................... (2,906) (2,479)
Total premises and equipment, net ............................................... $ 3,587 $ 2,748
Depreciation and amortization expense from continuing operations was $468 million, $317 million and $327
million, for the years ended December 31, 2012, 2011 and 2010, respectively.
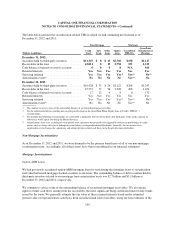
Lease Commitments
Certain premises and equipment are leased under agreements that expire at various dates through 2056, without
taking into consideration available renewal options. Many of these leases provide for payment by the lessee of
property taxes, insurance premiums, cost of maintenance and other costs. In some cases, rentals are subject to
206