Capital One 2012 Annual Report Download - page 138
Download and view the complete annual report
Please find page 138 of the 2012 Capital One annual report below. You can navigate through the pages in the report by either clicking on the pages listed below, or by using the keyword search tool below to find specific information within the annual report.-
 1
1 -
2
-
3
-
4
-
5
-
6
-
7
-
8
-
9
-
10
-
11
-
12
-
13
-
14
-
15
-
16
-
17
-
18
-
19
-
20
-
21
-
22
-
23
-
24
-
25
-
26
-
27
-
28
-
29
-
30
-
31
-
32
-
33
-
34
-
35
-
36
-
37
-
38
-
39
-
40
-
41
-
42
-
43
-
44
-
45
-
46
-
47
-
48
-
49
-
50
-
51
-
52
-
53
-
54
-
55
-
56
-
57
-
58
-
59
-
60
-
61
-
62
-
63
-
64
-
65
-
66
-
67
-
68
-
69
-
70
-
71
-
72
-
73
-
74
-
75
-
76
-
77
-
78
-
79
-
80
-
81
-
82
-
83
-
84
-
85
-
86
-
87
-
88
-
89
-
90
-
91
-
92
-
93
-
94
-
95
-
96
-
97
-
98
-
99
-
100
-
101
-
102
-
103
-
104
-
105
-
106
-
107
-
108
-
109
-
110
-
111
-
112
-
113
-
114
-
115
-
116
-
117
-
118
-
119
-
120
-
121
-
122
-
123
-
124
-
125
-
126
-
127
-
 128
128 -
 129
129 -
 130
130 -
 131
131 -
 132
132 -
 133
133 -
 134
134 -
 135
135 -
 136
136 -
 137
137 -
 138
138 -
 139
139 -
 140
140 -
 141
141 -
 142
142 -
 143
143 -
 144
144 -
 145
145 -
 146
146 -
 147
147 -
 148
148 -
149
-
150
-
151
-
152
-
153
-
154
-
155
-
156
-
157
-
158
-
159
-
160
-
161
-
162
-
163
-
164
-
165
-
166
-
167
-
168
-
169
-
170
-
171
-
172
-
173
-
174
-
175
-
176
-
177
-
178
-
179
-
180
-
181
-
182
-
183
-
184
-
185
-
186
-
187
-
188
-
189
-
190
-
191
-
192
-
193
-
194
-
195
-
196
-
197
-
198
-
199
-
200
-
201
-
202
-
203
-
204
-
205
-
206
-
207
-
208
-
209
-
210
-
211
-
212
-
213
-
214
-
215
-
216
-
217
-
218
-
219
-
220
-
221
-
222
-
223
-
224
-
225
-
226
-
227
-
228
-
229
-
230
-
231
-
232
-
233
-
234
-
235
-
236
-
237
-
238
-
239
-
240
-
241
-
242
-
243
-
244
-
245
-
246
-
247
-
248
-
249
-
250
-
251
-
252
-
253
-
254
-
255
-
256
-
257
-
258
-
259
-
260
-
261
-
262
-
263
-
264
-
265
-
266
-
267
-
268
-
269
-
270
-
271
-
272
-
273
-
274
-
275
-
276
-
277
-
278
-
279
-
280
-
281
-
282
-
283
-
284
-
285
-
286
-
287
-
288
-
289
-
290
-
291
-
292
-
293
-
294
-
295
-
296
-
297
-
298
-
299
-
300
-
301
-
302
-
303
-
304
-
305
-
306
-
307
-
308
-
309
-
310
-
311
 |
 |
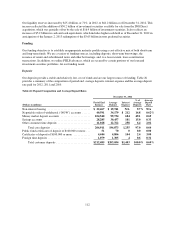
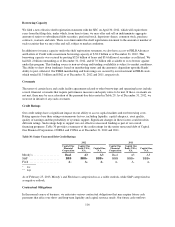
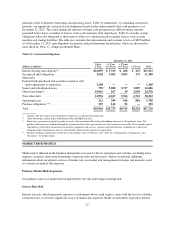
Market Risk Measurement
We have prescribed risk management policies and limits established by our Asset/Liability Management
Committee and approved by the Finance Committee of the Board. Our objective is to manage our asset/liability
risk position and exposure to market risk in accordance with these policies and prescribed limits based on
prevailing market conditions and long-term expectations. Because no single measure can reflect all aspects of
market risk, we use various industry standard market risk measurement techniques and analyses to measure,
assess and manage the impact of changes in interest rates and foreign exchange rates on our earnings and the
economic value of equity.
We consider the impact on both earnings and economic value of equity in measuring and managing our interest
rate risk. Our earnings sensitivity measure estimates the impact on net interest income and the valuation of our
mortgage servicing rights, including derivative hedging activity, resulting from movements in interest rates. Our
economic value of equity sensitivity measure estimates the impact on the net present value of our assets and
liabilities, including derivative hedging activity, resulting from movements in interest rates. Our economic value
of equity sensitivity measurements are based on our existing assets and liabilities, including derivatives, and do
not incorporate business growth assumptions or projected plans for funding mix changes.
The federal funds rate remained at a target range of zero to 0.25% during 2012. Given the level of short-term
rates as of December 31, 2012 and 2011, a scenario where interest rates would decline by 200 basis points is not
plausible. In 2008, we temporarily revised our customary declining interest rate scenario of 200 basis points to a
50 basis point decrease, except in scenarios where a 50 basis point decline would result in a rate less than 0% (in
which case we assume a rate scenario of 0%), to compensate for the continued low rate environment. Our current
asset/liability management policy also includes the use of derivatives to hedge material foreign currency
denominated transactions to limit our earnings exposure to foreign exchange risk.
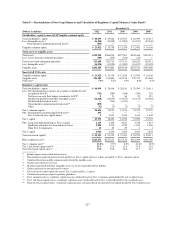
Table 32 shows the estimated percentage impact on our adjusted projected net interest income and economic
value of equity, calculated under alternative hypothetical interest rate scenarios, as of December 31, 2012 and
2011. Our adjusted projected net interest income consists of net interest income adjusted to include changes in
the fair value of mortgage servicing rights, including related derivative hedging activity, and changes in the fair
value of free-standing interest rate swaps. In measuring the sensitivity of interest rate movements on our adjusted
projected net interest income, we assume a hypothetical gradual increase in interest rates of 200 basis points and
a hypothetical gradual decrease of 50 basis points relative to implied forward rates over the next twelve months.
In measuring the sensitivity of interest rate movements on our economic value of equity, we assume a
hypothetical instantaneous parallel shift in the level of interest rates of plus 200 basis points and minus 50 basis
points to spot rates.
We recently revised two assumptions used to calculate our earnings sensitivity measures. First, in addition to our
existing assets and liabilities, we now incorporate expected future business growth assumptions, such as loan and
deposit growth and pricing, and plans for projected changes in our funding mix in our baseline forecast. Second,
we changed the interest rate scenario used to measure and evaluate the impact on the baseline forecast to assess
our earnings sensitivity. We previously measured our earnings sensitivity assuming a gradual plus or minus 200
basis point change in forward rates. Our assumption is now based on an instantaneous plus or minus 200 basis
point shock as described above, with the lower rate scenario limited to zero. We will continue to factor into our
interest rate risk management decisions the potential impact of alternative interest rate scenarios, such as stressed
rate shocks as well as steepening and flattening yield curve scenarios, for all of sensitivity measures.
Table 32 includes our earnings sensitivity as of December 31, 2012 based on our revised methodology, as well as
our previous methodology. Our revised methodology results in a slightly higher asset sensitivity position, which
is attributable to a higher forecasted volume of rate sensitive assets versus rate sensitive liabilities and the impact
of a more severe instantaneous shock. We have not revised our methodology for measuring our economic value
of equity sensitivities. Accordingly, the economic value sensitivity measures presented under our revised
methodology are the same as those presented under our previous methodology.
119