Capital One 2012 Annual Report Download - page 287
Download and view the complete annual report
Please find page 287 of the 2012 Capital One annual report below. You can navigate through the pages in the report by either clicking on the pages listed below, or by using the keyword search tool below to find specific information within the annual report.-
 1
1 -
2
-
3
-
4
-
5
-
6
-
7
-
8
-
9
-
10
-
11
-
12
-
13
-
14
-
15
-
16
-
17
-
18
-
19
-
20
-
21
-
22
-
23
-
24
-
25
-
26
-
27
-
28
-
29
-
30
-
31
-
32
-
33
-
34
-
35
-
36
-
37
-
38
-
39
-
40
-
41
-
42
-
43
-
44
-
45
-
46
-
47
-
48
-
49
-
50
-
51
-
52
-
53
-
54
-
55
-
56
-
57
-
58
-
59
-
60
-
61
-
62
-
63
-
64
-
65
-
66
-
67
-
68
-
69
-
70
-
71
-
72
-
73
-
74
-
75
-
76
-
77
-
78
-
79
-
80
-
81
-
82
-
83
-
84
-
85
-
86
-
87
-
88
-
89
-
90
-
91
-
92
-
93
-
94
-
95
-
96
-
97
-
98
-
99
-
100
-
101
-
102
-
103
-
104
-
105
-
106
-
107
-
108
-
109
-
110
-
111
-
112
-
113
-
114
-
115
-
116
-
117
-
118
-
119
-
120
-
121
-
122
-
123
-
124
-
125
-
126
-
127
-
128
-
129
-
130
-
131
-
132
-
133
-
134
-
135
-
136
-
137
-
138
-
139
-
140
-
141
-
142
-
143
-
144
-
145
-
146
-
147
-
148
-
149
-
150
-
151
-
152
-
153
-
154
-
155
-
156
-
157
-
158
-
159
-
160
-
161
-
162
-
163
-
164
-
165
-
166
-
167
-
168
-
169
-
170
-
171
-
172
-
173
-
174
-
175
-
176
-
177
-
178
-
179
-
180
-
181
-
182
-
183
-
184
-
185
-
186
-
187
-
188
-
189
-
190
-
191
-
192
-
193
-
194
-
195
-
196
-
197
-
198
-
199
-
200
-
201
-
202
-
203
-
204
-
205
-
206
-
207
-
208
-
209
-
210
-
211
-
212
-
213
-
214
-
215
-
216
-
217
-
218
-
219
-
220
-
221
-
222
-
223
-
224
-
225
-
226
-
227
-
228
-
229
-
230
-
231
-
232
-
233
-
234
-
235
-
236
-
237
-
238
-
239
-
240
-
241
-
242
-
243
-
244
-
245
-
246
-
247
-
248
-
249
-
250
-
251
-
252
-
253
-
254
-
255
-
256
-
257
-
258
-
259
-
260
-
261
-
262
-
263
-
264
-
265
-
266
-
267
-
268
-
269
-
270
-
271
-
272
-
273
-
274
-
275
-
276
-
 277
277 -
 278
278 -
 279
279 -
 280
280 -
 281
281 -
 282
282 -
 283
283 -
 284
284 -
 285
285 -
 286
286 -
 287
287 -
 288
288 -
 289
289 -
 290
290 -
 291
291 -
 292
292 -
 293
293 -
 294
294 -
 295
295 -
 296
296 -
 297
297 -
298
-
299
-
300
-
301
-
302
-
303
-
304
-
305
-
306
-
307
-
308
-
309
-
310
-
311
 |
 |

CAPITAL ONE FINANCIAL CORPORATION
NOTES TO CONSOLIDATED FINANCIAL STATEMENTS—(Continued)
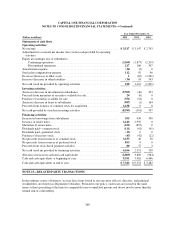
Year Ended December 31,
(Dollars in millions) 2012 2011 2010
Statements of cash flows
Operating activities:
Net income ......................................................... $ 3,517 $ 3,147 $ 2,743
Adjustments to reconcile net income (loss) to net cash provided by operating
activities:
Equity in (earnings) loss of subsidiaries:
Continuing operations ............................................ (3,569) (1,877) (2,319)
Discontinued operations ........................................... 217 106 307
Amortization expense ................................................. (24) (2) 0
Stock plan compensation expense ....................................... 112 92 96
Decrease (Increase) in other assets ...................................... 1(65) (3,261)
Increase (decrease) in other liabilities .................................... (34) 18 543
Net cash (used in) provided by operating activities .......................... 220 1,419 (1,891)
Investing activities:
(Increase) decrease in investment in subsidiaries ........................... (9,709) (46) 433
Proceeds from maturities of securities available for sale ...................... 24 (0) 0
Purchase of securities available for sale ................................... (351) (54) 0
(Increase) decrease in loans to subsidiaries ................................ (997) (1) 164
Proceeds from issuance of common stock for acquisition ..................... 2,638 00
Net cash provided by (used in) investing activities .......................... (8,395) (101) 597
Financing activities:
Increase in borrowings from subsidiaries ................................. 555 450 390
Issuance of senior notes ............................................... 2,246 2,992 0
Maturities of senior notes .............................................. (632) (855) 0
Dividends paid—common stock ........................................ (111) (91) (91)
Dividends paid—preferred stock ........................................ (15) 00
Purchases of treasury stock ............................................ (43) (42) (22)
Net proceeds from issuances of common stock ............................. 3,233 40 30
Net proceeds from issuances of preferred stock ............................ 853 00
Proceeds from stock-based payment activities ............................. 80 57 3
Net cash (used in) provided by financing activities .......................... 6,166 2,551 310
(Decrease) increase in cash and cash equivalents ........................... (2,009) 3,869 (984)
Cash and cash equivalents at beginning of year ............................. 9,351 5,482 6,466
Cash and cash equivalents at end of year .................................. $ 7,342 $ 9,351 $ 5,482
NOTE 23—RELATED PARTY TRANSACTIONS
In the ordinary course of business, we may have loans issued to our executive officers, directors, and principal
stockholders, also known as Regulation O Insiders. Pursuant to our policy, such loans are issued on the same
terms as those prevailing at the time for comparable loans to unrelated persons and do not involve more than the
normal risk of collectability.
268