Capital One 2012 Annual Report Download - page 289
Download and view the complete annual report
Please find page 289 of the 2012 Capital One annual report below. You can navigate through the pages in the report by either clicking on the pages listed below, or by using the keyword search tool below to find specific information within the annual report.-
 1
1 -
2
-
3
-
4
-
5
-
6
-
7
-
8
-
9
-
10
-
11
-
12
-
13
-
14
-
15
-
16
-
17
-
18
-
19
-
20
-
21
-
22
-
23
-
24
-
25
-
26
-
27
-
28
-
29
-
30
-
31
-
32
-
33
-
34
-
35
-
36
-
37
-
38
-
39
-
40
-
41
-
42
-
43
-
44
-
45
-
46
-
47
-
48
-
49
-
50
-
51
-
52
-
53
-
54
-
55
-
56
-
57
-
58
-
59
-
60
-
61
-
62
-
63
-
64
-
65
-
66
-
67
-
68
-
69
-
70
-
71
-
72
-
73
-
74
-
75
-
76
-
77
-
78
-
79
-
80
-
81
-
82
-
83
-
84
-
85
-
86
-
87
-
88
-
89
-
90
-
91
-
92
-
93
-
94
-
95
-
96
-
97
-
98
-
99
-
100
-
101
-
102
-
103
-
104
-
105
-
106
-
107
-
108
-
109
-
110
-
111
-
112
-
113
-
114
-
115
-
116
-
117
-
118
-
119
-
120
-
121
-
122
-
123
-
124
-
125
-
126
-
127
-
128
-
129
-
130
-
131
-
132
-
133
-
134
-
135
-
136
-
137
-
138
-
139
-
140
-
141
-
142
-
143
-
144
-
145
-
146
-
147
-
148
-
149
-
150
-
151
-
152
-
153
-
154
-
155
-
156
-
157
-
158
-
159
-
160
-
161
-
162
-
163
-
164
-
165
-
166
-
167
-
168
-
169
-
170
-
171
-
172
-
173
-
174
-
175
-
176
-
177
-
178
-
179
-
180
-
181
-
182
-
183
-
184
-
185
-
186
-
187
-
188
-
189
-
190
-
191
-
192
-
193
-
194
-
195
-
196
-
197
-
198
-
199
-
200
-
201
-
202
-
203
-
204
-
205
-
206
-
207
-
208
-
209
-
210
-
211
-
212
-
213
-
214
-
215
-
216
-
217
-
218
-
219
-
220
-
221
-
222
-
223
-
224
-
225
-
226
-
227
-
228
-
229
-
230
-
231
-
232
-
233
-
234
-
235
-
236
-
237
-
238
-
239
-
240
-
241
-
242
-
243
-
244
-
245
-
246
-
247
-
248
-
249
-
250
-
251
-
252
-
253
-
254
-
255
-
256
-
257
-
258
-
259
-
260
-
261
-
262
-
263
-
264
-
265
-
266
-
267
-
268
-
269
-
270
-
271
-
272
-
273
-
274
-
275
-
276
-
277
-
278
-
 279
279 -
 280
280 -
 281
281 -
 282
282 -
 283
283 -
 284
284 -
 285
285 -
 286
286 -
 287
287 -
 288
288 -
 289
289 -
 290
290 -
 291
291 -
 292
292 -
 293
293 -
 294
294 -
 295
295 -
 296
296 -
 297
297 -
 298
298 -
 299
299 -
300
-
301
-
302
-
303
-
304
-
305
-
306
-
307
-
308
-
309
-
310
-
311
 |
 |

CAPITAL ONE FINANCIAL CORPORATION
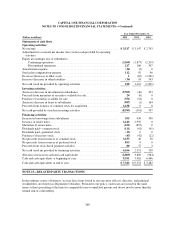
Selected Quarterly Financial Information(1) (2) (3)
2012 2011
(Dollars in millions, except per share data)
(unaudited) Q4 Q3 Q2 Q1 Q4 Q3 Q2 Q1
Summarized results of operations:
Interestincome.......................... $ 5,115 $ 5,254 $ 4,616 $ 3,979 $ 3,701 $ 3,835 $ 3,699 $ 3,752
Interestexpense ......................... 587 608 615 565 519 552 563 612
Netinterestincome ...................... 4,528 4,646 4,001 3,414 3,182 3,283 3,136 3,140
Provision for credit losses(4) ................ 1,151 1,014 1,677 573 861 622 343 534
Net interest income after provision for credit
losses ............................... 3,377 3,632 2,324 2,841 2,321 2,661 2,793 2,606
Non-interestincome...................... 1,096 1,136 1,054 1,521 868 871 857 942
Non-interestexpense ..................... 3,255 3,045 3,142 2,504 2,618 2,297 2,255 2,162
Income from continuing operations before
incometaxes ......................... 1,218 1,723 236 1,858 571 1,235 1,395 1,386
Incometaxes ........................... 370 535 43 353 160 370 450 354
Income from continuing operations, net of tax . . 848 1,188 193 1,505 411 865 945 1,032
Loss from discontinued operations, net of tax . . . (5) (10) (100) (102) (4) (52) (34) (16)
Netincome ............................ 843 1,178 93 1,403 407 813 911 1,016
Dividends and undistributed earnings allocated
to participating securities(5) ............... (3) (5) (1) (7) (26) — — —
Preferredstockdividends .................. (15) — — — ————
Net income available to common
stockholders .......................... $ 825 $ 1,173 $ 92 $ 1,396 $ 381 $ 813 $ 911 $ 1,016
Per common share:
Basic EPS(5):
Income from continuing operations . . . . . . $ 1.43 $ 2.05 $ 0.33 $ 2.94 $ 0.89 $ 1.89 $ 2.07 $ 2.27
Loss from discontinued operations . . . . . . . (0.01) (0.02) (0.17) (0.20) (0.01) (0.11) (0.07) (0.03)
Netincome ........................ $ 1.42 $ 2.03 $ 0.16 $ 2.74 $ 0.88 $ 1.78 $ 2.00 $ 2.24
Diluted EPS(5):
Income from continuing operations . . . . . . $ 1.42 $ 2.03 $ 0.33 $ 2.92 $ 0.89 $ 1.88 $ 2.04 $ 2.24
Loss from discontinued operations . . . . . . . (0.01) (0.02) (0.17) (0.20) (0.01) (0.11) (0.07) (0.03)
Netincome ........................ $ 1.41 $ 2.01 $ 0.16 $ 2.72 $ 0.88 $ 1.77 $ 1.97 $ 2.21
Weighted average common shares outstanding
(millions):
BasicEPS ......................... 579.2 578.3 577.7 508.7 456.2 456.0 455.6 454.1
DilutedEPS ........................ 585.6 584.1 582.8 513.1 458.5 460.4 462.2 460.3
Average balance sheet data:
Loansheldforinvestment ................. $202,944 $202,856 $192,632 $152,900 $131,581 $129,043 $127,916 $125,077
Interest-earningassets .................... 277,886 266,803 265,019 220,246 176,271 177,531 174,113 173,440
Totalassets ............................ 308,096 297,154 295,306 246,384 200,106 201,611 199,229 198,075
Interest-bearingdeposits................... 192,122 193,700 195,597 151,625 109,914 110,750 109,251 108,633
Borrowings ............................ 44,189 36,451 35,418 35,994 34,811 37,366 39,451 40,538
Stockholders’ equity ..................... 40,212 38,535 37,533 32,982 29,698 29,316 28,255 27,009
(1) Certain prior period amounts have been reclassified to conform to the current period presentation.
(2) Results for Q2 2012 and thereafter include the impact of the May 1, 2012 closing of the 2012 U.S. card acquisition, which resulted in the
addition of approximately $28.2 billion in credit card receivables at closing.
(3) Results for Q1 2012 and thereafter include the impact of the February 17, 2012 acquisition of ING Direct, which resulted in the addition
of loans of $40.4 billion, other assets of $53.9 billion and deposits of $84.4 billion at acquisition.
(4) Results for Q2 2012 include a provision for credit losses of $1.2 billion to establish an allowance for the loans acquired in the 2012 U.S.
card acquisition.
(5) Dividends and undistributed earnings allocated to participating securities and EPS are computed independently for each period.
Accordingly, the sum of each quarter may not agree to the year-to-date total.
270