Capital One 2012 Annual Report Download - page 90
Download and view the complete annual report
Please find page 90 of the 2012 Capital One annual report below. You can navigate through the pages in the report by either clicking on the pages listed below, or by using the keyword search tool below to find specific information within the annual report.-
 1
1 -
2
-
3
-
4
-
5
-
6
-
7
-
8
-
9
-
10
-
11
-
12
-
13
-
14
-
15
-
16
-
17
-
18
-
19
-
20
-
21
-
22
-
23
-
24
-
25
-
26
-
27
-
28
-
29
-
30
-
31
-
32
-
33
-
34
-
35
-
36
-
37
-
38
-
39
-
40
-
41
-
42
-
43
-
44
-
45
-
46
-
47
-
48
-
49
-
50
-
51
-
52
-
53
-
54
-
55
-
56
-
57
-
58
-
59
-
60
-
61
-
62
-
63
-
64
-
65
-
66
-
67
-
68
-
69
-
70
-
71
-
72
-
73
-
74
-
75
-
76
-
77
-
78
-
79
-
 80
80 -
 81
81 -
 82
82 -
 83
83 -
 84
84 -
 85
85 -
 86
86 -
 87
87 -
 88
88 -
 89
89 -
 90
90 -
 91
91 -
 92
92 -
 93
93 -
 94
94 -
 95
95 -
 96
96 -
 97
97 -
 98
98 -
 99
99 -
 100
100 -
101
-
102
-
103
-
104
-
105
-
106
-
107
-
108
-
109
-
110
-
111
-
112
-
113
-
114
-
115
-
116
-
117
-
118
-
119
-
120
-
121
-
122
-
123
-
124
-
125
-
126
-
127
-
128
-
129
-
130
-
131
-
132
-
133
-
134
-
135
-
136
-
137
-
138
-
139
-
140
-
141
-
142
-
143
-
144
-
145
-
146
-
147
-
148
-
149
-
150
-
151
-
152
-
153
-
154
-
155
-
156
-
157
-
158
-
159
-
160
-
161
-
162
-
163
-
164
-
165
-
166
-
167
-
168
-
169
-
170
-
171
-
172
-
173
-
174
-
175
-
176
-
177
-
178
-
179
-
180
-
181
-
182
-
183
-
184
-
185
-
186
-
187
-
188
-
189
-
190
-
191
-
192
-
193
-
194
-
195
-
196
-
197
-
198
-
199
-
200
-
201
-
202
-
203
-
204
-
205
-
206
-
207
-
208
-
209
-
210
-
211
-
212
-
213
-
214
-
215
-
216
-
217
-
218
-
219
-
220
-
221
-
222
-
223
-
224
-
225
-
226
-
227
-
228
-
229
-
230
-
231
-
232
-
233
-
234
-
235
-
236
-
237
-
238
-
239
-
240
-
241
-
242
-
243
-
244
-
245
-
246
-
247
-
248
-
249
-
250
-
251
-
252
-
253
-
254
-
255
-
256
-
257
-
258
-
259
-
260
-
261
-
262
-
263
-
264
-
265
-
266
-
267
-
268
-
269
-
270
-
271
-
272
-
273
-
274
-
275
-
276
-
277
-
278
-
279
-
280
-
281
-
282
-
283
-
284
-
285
-
286
-
287
-
288
-
289
-
290
-
291
-
292
-
293
-
294
-
295
-
296
-
297
-
298
-
299
-
300
-
301
-
302
-
303
-
304
-
305
-
306
-
307
-
308
-
309
-
310
-
311
 |
 |
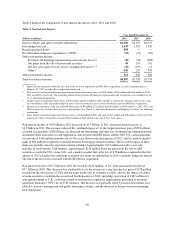
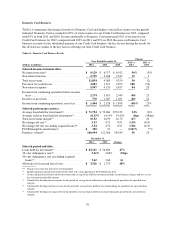
(6) Calculation of ratio adjusted to exclude from the denominator acquired loans accounted for subsequent to acquisition based on expected
cash flows to be collected. See “Item 6. Selected Financial Data,” “Credit Risk Profile” and “Note 5—Loans—Credit Quality” for
additional information on the impact of acquired loans on our credit quality metrics.
(7) Includes amortization expense of $334 million in 2012 related to the purchased credit card relationships intangible asset of $2.2 billion
recorded in connection with the closing on May 1, 2012 of the 2012 U.S. card acquisition.
(8) Consists of purchase transactions for the period, net of returns. Excludes cash advance transactions.
(9) Calculated by loan category by dividing 30+ day delinquent loans as of the end of the period by period-end loans held for investment for
the specified loan category.
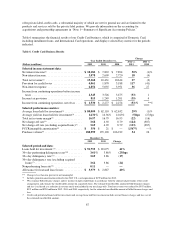
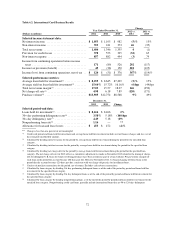
Domestic Card generated net income from continuing operations of $1.4 billion in 2012, compared with net
income from continuing operations of $2.3 billion in 2011. The decrease in Domestic Card net income in 2012
from 2011 reflected an increase in total net revenue largely due to the addition of loans from the 2012 U.S. card
acquisition, which was more than offset by the unfavorable impact of several items related to the 2012 U.S. card
acquisition. These items included: (i) a significant increase in the provision for credit losses resulting from an
initial allowance build of $1.2 billion related to the portfolio purchased in the 2012 U.S. card acquisition; (ii) an
increase in non-interest expense largely resulting from operating expenses related to the 2012 U.S. card
acquisition and the amortization of intangibles and other assets associated with the 2012 U.S. card acquisition,
including PCCR intangible amortization expense of $334 million in 2012; and (iii) a regulatory fine related to
cross-sell activities of $60 million in 2012.
Domestic Card generated net income from continuing operations of $2.3 billion in 2011, compared with net
income from continuing operations of $1.9 billion in 2010. The increase in Domestic Card net income from
continuing operations in 2011 from 2010 was driven by a significant reduction in the provision for credit losses
due to the improvement in credit performance metrics, including decreases in delinquency and charge-off rates.
This increase was partially offset by a decline in total revenue attributable to lower average loan balances and an
increase in non-interest expense attributable to increased marketing expenditures, higher legal expenses and
increased operating costs.
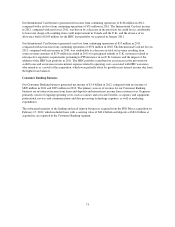
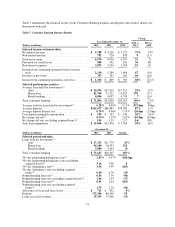
International Card Business
Table 6.2 summarizes the financial results for International Card and displays selected key metrics for the
periods indicated. International Card accounted for 11% of total revenues for our Credit Card business in 2012,
compared with 13% in both 2011 and 2010. Income attributable to International Card represented 8% of income
for our Credit Card business for 2012 and 17% in 2010. Our International Card business posted a loss that
represented 2% of income for our Credit Card business in 2011.
71