Capital One 2012 Annual Report Download - page 93
Download and view the complete annual report
Please find page 93 of the 2012 Capital One annual report below. You can navigate through the pages in the report by either clicking on the pages listed below, or by using the keyword search tool below to find specific information within the annual report.-
 1
1 -
2
-
3
-
4
-
5
-
6
-
7
-
8
-
9
-
10
-
11
-
12
-
13
-
14
-
15
-
16
-
17
-
18
-
19
-
20
-
21
-
22
-
23
-
24
-
25
-
26
-
27
-
28
-
29
-
30
-
31
-
32
-
33
-
34
-
35
-
36
-
37
-
38
-
39
-
40
-
41
-
42
-
43
-
44
-
45
-
46
-
47
-
48
-
49
-
50
-
51
-
52
-
53
-
54
-
55
-
56
-
57
-
58
-
59
-
60
-
61
-
62
-
63
-
64
-
65
-
66
-
67
-
68
-
69
-
70
-
71
-
72
-
73
-
74
-
75
-
76
-
77
-
78
-
79
-
80
-
81
-
82
-
 83
83 -
 84
84 -
 85
85 -
 86
86 -
 87
87 -
 88
88 -
 89
89 -
 90
90 -
 91
91 -
 92
92 -
 93
93 -
 94
94 -
 95
95 -
 96
96 -
 97
97 -
 98
98 -
 99
99 -
 100
100 -
 101
101 -
 102
102 -
 103
103 -
104
-
105
-
106
-
107
-
108
-
109
-
110
-
111
-
112
-
113
-
114
-
115
-
116
-
117
-
118
-
119
-
120
-
121
-
122
-
123
-
124
-
125
-
126
-
127
-
128
-
129
-
130
-
131
-
132
-
133
-
134
-
135
-
136
-
137
-
138
-
139
-
140
-
141
-
142
-
143
-
144
-
145
-
146
-
147
-
148
-
149
-
150
-
151
-
152
-
153
-
154
-
155
-
156
-
157
-
158
-
159
-
160
-
161
-
162
-
163
-
164
-
165
-
166
-
167
-
168
-
169
-
170
-
171
-
172
-
173
-
174
-
175
-
176
-
177
-
178
-
179
-
180
-
181
-
182
-
183
-
184
-
185
-
186
-
187
-
188
-
189
-
190
-
191
-
192
-
193
-
194
-
195
-
196
-
197
-
198
-
199
-
200
-
201
-
202
-
203
-
204
-
205
-
206
-
207
-
208
-
209
-
210
-
211
-
212
-
213
-
214
-
215
-
216
-
217
-
218
-
219
-
220
-
221
-
222
-
223
-
224
-
225
-
226
-
227
-
228
-
229
-
230
-
231
-
232
-
233
-
234
-
235
-
236
-
237
-
238
-
239
-
240
-
241
-
242
-
243
-
244
-
245
-
246
-
247
-
248
-
249
-
250
-
251
-
252
-
253
-
254
-
255
-
256
-
257
-
258
-
259
-
260
-
261
-
262
-
263
-
264
-
265
-
266
-
267
-
268
-
269
-
270
-
271
-
272
-
273
-
274
-
275
-
276
-
277
-
278
-
279
-
280
-
281
-
282
-
283
-
284
-
285
-
286
-
287
-
288
-
289
-
290
-
291
-
292
-
293
-
294
-
295
-
296
-
297
-
298
-
299
-
300
-
301
-
302
-
303
-
304
-
305
-
306
-
307
-
308
-
309
-
310
-
311
 |
 |

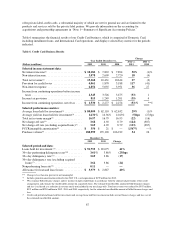
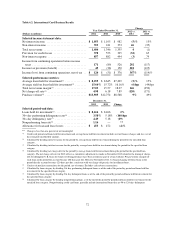
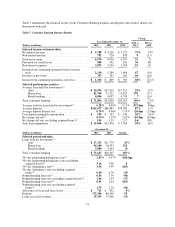
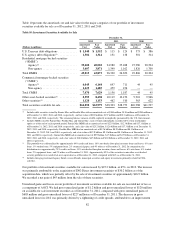
Table 7 summarizes the financial results of our Consumer Banking business and displays selected key metrics for
the periods indicated.
Table 7: Consumer Banking Business Results
(Dollars in millions)
Change
Year Ended December 31, 2012 vs.
2011
2011 vs.
20102012 2011 2010
Selected income statement data:
Net interest income .............................. $ 5,788 $ 4,236 $ 3,727 37% 14%
Non-interest income ............................. 782 720 870 9(17)
Total net revenue ............................... 6,570 4,956 4,597 33 8
Provision for credit losses ......................... 589 452 241 30 88
Non-interest expense ............................ 3,871 3,244 2,950 19 10
Income from continuing operations before income
taxes ....................................... 2,110 1,260 1,406 67 (10)
Income tax provision ............................ 747 451 501 66 (10)
Income from continuing operations, net of tax ......... $ 1,363 $ 809 $ 905 68% (11)%
Selected performance metrics:
Average loans held for investment:(1)
Auto ..................................... $ 24,976 $19,419 $17,551 29% 11%
Home loan ................................. 42,764 11,322 13,629 278 (17)
Retail banking .............................. 4,096 4,097 4,745 ** (14)
Total consumer banking .......................... $ 71,836 $34,838 $35,925 106% (3)%
Average yield on loans held for investment(2) ......... 6.28% 9.60% 9.11% (332)bps 49bps
Average deposits ................................ $162,637 $86,883 $78,083 87% 11%
Average deposit interest rate ...................... 0.70% 0.96% 1.19% (26)bps (23)bps
Core deposit intangible amortization ................ $ 159 $ 132 $ 144 20% (8)%
Net charge-off rate(3) ............................. 0.74% 1.39% 1.82% (65)bps (43)bps
Net charge-off rate (excluding acquired loans)(4) ....... 1.45 1.59 2.17 (14) (58)
Auto loan originations ........................... $ 15,960 $12,476 $ 7,764 28% 61%
(Dollars in millions)
December 31,
Change2012 2011
Selected period-end data:
Loans held for investment:(1)
Auto ..................................... $ 27,123 $21,779 25%
Home loan ................................. 44,100 10,433 323
Retail banking .............................. 3,904 4,103 (5)
Total consumer banking .......................... $ 75,127 $36,315 107%
30+ day performing delinquency rate(5) .............. 2.65% 4.47% (182)bps
30+ day performing delinquency rate (excluding
acquired loans)(4) .............................. 5.14 5.06 8
30+ day delinquency rate(6) ........................ 3.34 5.99 (265)
30+ day delinquency rate (excluding acquired
loans)(4) ..................................... 6.49 6.78 (29)
Nonperforming loan rate(7) ........................ 0.85 1.79 (94)
Nonperforming loan rate (excluding acquired loans)(4) .. 1.66 2.03 (37)
Nonperforming asset rate(8) ........................ 0.91 1.94 (103)
Nonperforming asset rate (excluding acquired
loans)(4) ..................................... 1.76 2.20 (44)
Allowance for loan and lease losses ................ $ 711 $ 652 9%
Deposits ...................................... 172,396 88,540 95
Loans serviced for others ......................... 15,333 17,998 (15)
74