Capital One 2012 Annual Report Download - page 215
Download and view the complete annual report
Please find page 215 of the 2012 Capital One annual report below. You can navigate through the pages in the report by either clicking on the pages listed below, or by using the keyword search tool below to find specific information within the annual report.-
 1
1 -
2
-
3
-
4
-
5
-
6
-
7
-
8
-
9
-
10
-
11
-
12
-
13
-
14
-
15
-
16
-
17
-
18
-
19
-
20
-
21
-
22
-
23
-
24
-
25
-
26
-
27
-
28
-
29
-
30
-
31
-
32
-
33
-
34
-
35
-
36
-
37
-
38
-
39
-
40
-
41
-
42
-
43
-
44
-
45
-
46
-
47
-
48
-
49
-
50
-
51
-
52
-
53
-
54
-
55
-
56
-
57
-
58
-
59
-
60
-
61
-
62
-
63
-
64
-
65
-
66
-
67
-
68
-
69
-
70
-
71
-
72
-
73
-
74
-
75
-
76
-
77
-
78
-
79
-
80
-
81
-
82
-
83
-
84
-
85
-
86
-
87
-
88
-
89
-
90
-
91
-
92
-
93
-
94
-
95
-
96
-
97
-
98
-
99
-
100
-
101
-
102
-
103
-
104
-
105
-
106
-
107
-
108
-
109
-
110
-
111
-
112
-
113
-
114
-
115
-
116
-
117
-
118
-
119
-
120
-
121
-
122
-
123
-
124
-
125
-
126
-
127
-
128
-
129
-
130
-
131
-
132
-
133
-
134
-
135
-
136
-
137
-
138
-
139
-
140
-
141
-
142
-
143
-
144
-
145
-
146
-
147
-
148
-
149
-
150
-
151
-
152
-
153
-
154
-
155
-
156
-
157
-
158
-
159
-
160
-
161
-
162
-
163
-
164
-
165
-
166
-
167
-
168
-
169
-
170
-
171
-
172
-
173
-
174
-
175
-
176
-
177
-
178
-
179
-
180
-
181
-
182
-
183
-
184
-
185
-
186
-
187
-
188
-
189
-
190
-
191
-
192
-
193
-
194
-
195
-
196
-
197
-
198
-
199
-
200
-
201
-
202
-
203
-
204
-
 205
205 -
 206
206 -
 207
207 -
 208
208 -
 209
209 -
 210
210 -
 211
211 -
 212
212 -
 213
213 -
 214
214 -
 215
215 -
 216
216 -
 217
217 -
 218
218 -
 219
219 -
 220
220 -
 221
221 -
 222
222 -
 223
223 -
 224
224 -
 225
225 -
226
-
227
-
228
-
229
-
230
-
231
-
232
-
233
-
234
-
235
-
236
-
237
-
238
-
239
-
240
-
241
-
242
-
243
-
244
-
245
-
246
-
247
-
248
-
249
-
250
-
251
-
252
-
253
-
254
-
255
-
256
-
257
-
258
-
259
-
260
-
261
-
262
-
263
-
264
-
265
-
266
-
267
-
268
-
269
-
270
-
271
-
272
-
273
-
274
-
275
-
276
-
277
-
278
-
279
-
280
-
281
-
282
-
283
-
284
-
285
-
286
-
287
-
288
-
289
-
290
-
291
-
292
-
293
-
294
-
295
-
296
-
297
-
298
-
299
-
300
-
301
-
302
-
303
-
304
-
305
-
306
-
307
-
308
-
309
-
310
-
311
 |
 |

CAPITAL ONE FINANCIAL CORPORATION
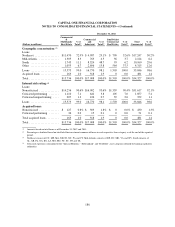
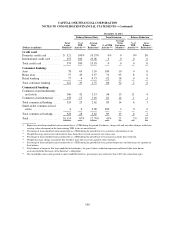
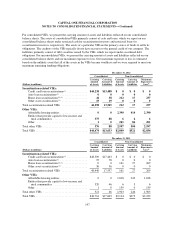
NOTES TO CONSOLIDATED FINANCIAL STATEMENTS—(Continued)
December 31, 2011
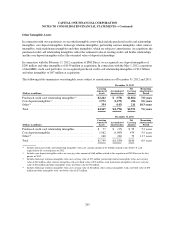
Consumer
(Dollars in millions)
Credit
Card Auto
Home
Loan
Retail
Banking
Total
Consumer Commercial Other Total
Allowance for loan and lease losses by
impairment methodology:
Collectively evaluated(1) ............. $ 2,494 $ 383 $ 65 $ 150 $ 598 $ 638 $ 36 $ 3,766
Asset-specific(2) ................... 353 8 10 12 30 75 0 458
Acquired loans(3) .................. 0 0 23 1 24 2 0 26
Total allowance for loan and lease
losses ......................... $ 2,847 $ 391 $ 98 $ 163 $ 652 $ 715 $ 36 $ 4,250
Held-for-investment loans by
impairment methodology:
Collectively evaluated(1) ............. $64,177 $21,674 $ 6,217 $3,968 $31,859 $33,198 $ 175 $129,409
Asset-specific(2) ................... 898 58 104 90 252 648 0 1,798
Acquired loans(3) .................. 0 47 4,112 45 4,204 481 0 4,685
Total held-for-investment loans ....... $65,075 $21,779 $10,433 $4,103 $36,315 $34,327 $ 175 $135,892
Allowance as a percentage of period-
end held-for-investment loans ...... 4.37% 1.80% 0.94% 3.97% 1.80% 2.08% 20.57% 3.13%
(1) The collectively evaluated component of the allowance for credit card and other consumer loans that we collectively evaluate for
impairment is based on a statistical calculation. The collectively evaluated component of the allowance for commercial loans, which we
collectively evaluate for impairment, is based on our historical loss experience for loans with similar characteristics and consideration of
credit quality supplemented by management judgment and interpretation.
(2) The asset-specific component of the allowance for smaller-balance impaired loans is calculated on a pool basis using historical loss
experience for the respective class of assets. The asset-specific component of the allowance for larger-balance commercial loans is
individually calculated for each loan.
(3) The acquired loans component of the allowance is accounted for based on expected cash flows. See “Note 5 – Loans” for details on these
loans.
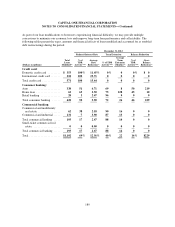
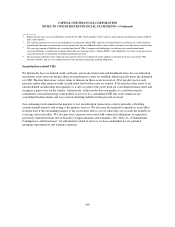
NOTE 7—VARIABLE INTEREST ENTITIES AND SECURITIZATIONS
In the normal course of business, we enter into various types of transactions with entities that are considered to
be VIEs. Historically, our primary involvement with VIEs has been related to our securitization transactions in
which we transferred assets from our balance sheet to securitization trusts. These securitization trusts typically
meet the definition of a VIE. We have generally securitized credit card loans, auto loans, home loans and
installment loans, which have provided a source of funding for us and as a means of transferring a certain portion
of the economic risk of the loans or debt securities to third parties.
The entity that has a controlling financial interest in a VIE is referred to as the primary beneficiary and is
required to consolidate the VIE. The vast majority of the VIEs in which we are involved have been consolidated
in our financial statements.
Summary of Consolidated and Unconsolidated VIEs
The table below presents a summary of VIEs, aggregated based on VIEs with similar characteristics, in which we
had continuing involvement or held a variable interest as of December 31, 2012 and 2011. We separately present
information for consolidated and unconsolidated VIEs.
196