Capital One 2012 Annual Report Download - page 207
Download and view the complete annual report
Please find page 207 of the 2012 Capital One annual report below. You can navigate through the pages in the report by either clicking on the pages listed below, or by using the keyword search tool below to find specific information within the annual report.-
 1
1 -
2
-
3
-
4
-
5
-
6
-
7
-
8
-
9
-
10
-
11
-
12
-
13
-
14
-
15
-
16
-
17
-
18
-
19
-
20
-
21
-
22
-
23
-
24
-
25
-
26
-
27
-
28
-
29
-
30
-
31
-
32
-
33
-
34
-
35
-
36
-
37
-
38
-
39
-
40
-
41
-
42
-
43
-
44
-
45
-
46
-
47
-
48
-
49
-
50
-
51
-
52
-
53
-
54
-
55
-
56
-
57
-
58
-
59
-
60
-
61
-
62
-
63
-
64
-
65
-
66
-
67
-
68
-
69
-
70
-
71
-
72
-
73
-
74
-
75
-
76
-
77
-
78
-
79
-
80
-
81
-
82
-
83
-
84
-
85
-
86
-
87
-
88
-
89
-
90
-
91
-
92
-
93
-
94
-
95
-
96
-
97
-
98
-
99
-
100
-
101
-
102
-
103
-
104
-
105
-
106
-
107
-
108
-
109
-
110
-
111
-
112
-
113
-
114
-
115
-
116
-
117
-
118
-
119
-
120
-
121
-
122
-
123
-
124
-
125
-
126
-
127
-
128
-
129
-
130
-
131
-
132
-
133
-
134
-
135
-
136
-
137
-
138
-
139
-
140
-
141
-
142
-
143
-
144
-
145
-
146
-
147
-
148
-
149
-
150
-
151
-
152
-
153
-
154
-
155
-
156
-
157
-
158
-
159
-
160
-
161
-
162
-
163
-
164
-
165
-
166
-
167
-
168
-
169
-
170
-
171
-
172
-
173
-
174
-
175
-
176
-
177
-
178
-
179
-
180
-
181
-
182
-
183
-
184
-
185
-
186
-
187
-
188
-
189
-
190
-
191
-
192
-
193
-
194
-
195
-
196
-
 197
197 -
 198
198 -
 199
199 -
 200
200 -
 201
201 -
 202
202 -
 203
203 -
 204
204 -
 205
205 -
 206
206 -
 207
207 -
 208
208 -
 209
209 -
 210
210 -
 211
211 -
 212
212 -
 213
213 -
 214
214 -
 215
215 -
 216
216 -
 217
217 -
218
-
219
-
220
-
221
-
222
-
223
-
224
-
225
-
226
-
227
-
228
-
229
-
230
-
231
-
232
-
233
-
234
-
235
-
236
-
237
-
238
-
239
-
240
-
241
-
242
-
243
-
244
-
245
-
246
-
247
-
248
-
249
-
250
-
251
-
252
-
253
-
254
-
255
-
256
-
257
-
258
-
259
-
260
-
261
-
262
-
263
-
264
-
265
-
266
-
267
-
268
-
269
-
270
-
271
-
272
-
273
-
274
-
275
-
276
-
277
-
278
-
279
-
280
-
281
-
282
-
283
-
284
-
285
-
286
-
287
-
288
-
289
-
290
-
291
-
292
-
293
-
294
-
295
-
296
-
297
-
298
-
299
-
300
-
301
-
302
-
303
-
304
-
305
-
306
-
307
-
308
-
309
-
310
-
311
 |
 |

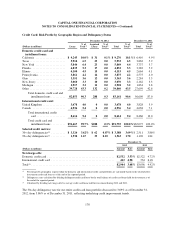
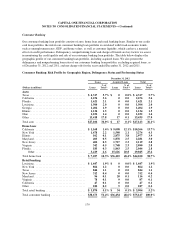
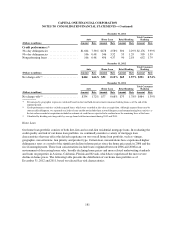
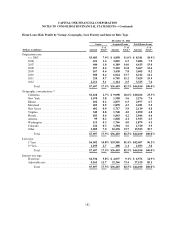
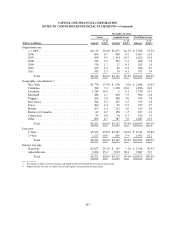
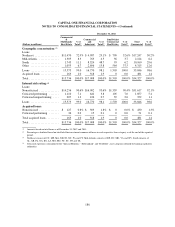
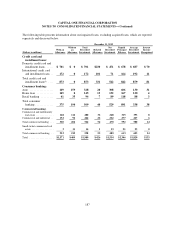
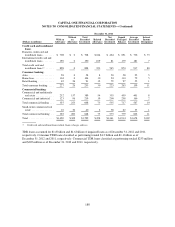
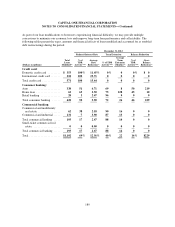
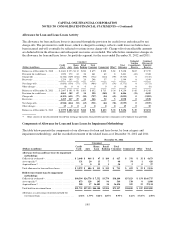
CAPITAL ONE FINANCIAL CORPORATION
NOTES TO CONSOLIDATED FINANCIAL STATEMENTS—(Continued)
December 31, 2011
(Dollars in millions)
With an
Allowance
Without
an
Allowance
Total
Recorded
Investment
Related
Allowance
Net
Recorded
Investment
Unpaid
Principal
Balance
Average
Recorded
Investment
Interest
Income
Recognized
Credit card and installment
loans:
Domestic credit card and
installment loans . . . . . . . . $ 708 $ 0 $ 708 $ 244 $ 464 $ 691 $ 736 $ 73
International credit card and
installment loans . . . . . . . . 190 0 190 109 81 179 181 7
Total credit card and
installment loans(1) . . . . . . 898 0 898 353 545 870 917 80
Consumer banking:
Auto .................... 58 0 58 8 50 58 25 5
Home loan ............... 104 0 104 10 94 110 79 5
Retail banking ............ 65 26 91 12 79 97 55 1
Total consumer banking . . . . 227 26 253 30 223 265 159 11
Commercial banking:
Commercial and multifamily
real estate . . . . . . . . . . . . . . 232 157 389 54 335 459 401 8
Commercial and industrial . . 123 96 219 19 200 258 166 2
Total commercial lending . . . 355 253 608 73 535 717 567 10
Small-ticket commercial real
estate ................. 10 30 40 2 38 62 35 1
Total commercial banking . . 365 283 648 75 573 779 602 11
Total ................... $1,490 $ 309 $1,799 $ 458 $1,341 $1,914 $1,678 $102
(1) Credit card and installment loans include finance charges and fees.
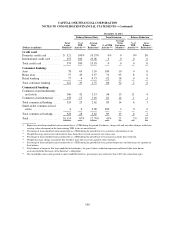
TDR loans accounted for $1.8 billion and $1.6 billion of impaired loans as of December 31, 2012 and 2011,
respectively. Consumer TDR loans classified as performing totaled $1.2 billion and $1.1 billion as of
December 31, 2012 and 2011, respectively. Commercial TDR loans classified as performing totaled $253 million
and $305 million as of December 31, 2012 and 2011, respectively.
188