Capital One 2012 Annual Report Download - page 119
Download and view the complete annual report
Please find page 119 of the 2012 Capital One annual report below. You can navigate through the pages in the report by either clicking on the pages listed below, or by using the keyword search tool below to find specific information within the annual report.-
 1
1 -
2
-
3
-
4
-
5
-
6
-
7
-
8
-
9
-
10
-
11
-
12
-
13
-
14
-
15
-
16
-
17
-
18
-
19
-
20
-
21
-
22
-
23
-
24
-
25
-
26
-
27
-
28
-
29
-
30
-
31
-
32
-
33
-
34
-
35
-
36
-
37
-
38
-
39
-
40
-
41
-
42
-
43
-
44
-
45
-
46
-
47
-
48
-
49
-
50
-
51
-
52
-
53
-
54
-
55
-
56
-
57
-
58
-
59
-
60
-
61
-
62
-
63
-
64
-
65
-
66
-
67
-
68
-
69
-
70
-
71
-
72
-
73
-
74
-
75
-
76
-
77
-
78
-
79
-
80
-
81
-
82
-
83
-
84
-
85
-
86
-
87
-
88
-
89
-
90
-
91
-
92
-
93
-
94
-
95
-
96
-
97
-
98
-
99
-
100
-
101
-
102
-
103
-
104
-
105
-
106
-
107
-
108
-
 109
109 -
 110
110 -
 111
111 -
 112
112 -
 113
113 -
 114
114 -
 115
115 -
 116
116 -
 117
117 -
 118
118 -
 119
119 -
 120
120 -
 121
121 -
 122
122 -
 123
123 -
 124
124 -
 125
125 -
 126
126 -
 127
127 -
 128
128 -
 129
129 -
130
-
131
-
132
-
133
-
134
-
135
-
136
-
137
-
138
-
139
-
140
-
141
-
142
-
143
-
144
-
145
-
146
-
147
-
148
-
149
-
150
-
151
-
152
-
153
-
154
-
155
-
156
-
157
-
158
-
159
-
160
-
161
-
162
-
163
-
164
-
165
-
166
-
167
-
168
-
169
-
170
-
171
-
172
-
173
-
174
-
175
-
176
-
177
-
178
-
179
-
180
-
181
-
182
-
183
-
184
-
185
-
186
-
187
-
188
-
189
-
190
-
191
-
192
-
193
-
194
-
195
-
196
-
197
-
198
-
199
-
200
-
201
-
202
-
203
-
204
-
205
-
206
-
207
-
208
-
209
-
210
-
211
-
212
-
213
-
214
-
215
-
216
-
217
-
218
-
219
-
220
-
221
-
222
-
223
-
224
-
225
-
226
-
227
-
228
-
229
-
230
-
231
-
232
-
233
-
234
-
235
-
236
-
237
-
238
-
239
-
240
-
241
-
242
-
243
-
244
-
245
-
246
-
247
-
248
-
249
-
250
-
251
-
252
-
253
-
254
-
255
-
256
-
257
-
258
-
259
-
260
-
261
-
262
-
263
-
264
-
265
-
266
-
267
-
268
-
269
-
270
-
271
-
272
-
273
-
274
-
275
-
276
-
277
-
278
-
279
-
280
-
281
-
282
-
283
-
284
-
285
-
286
-
287
-
288
-
289
-
290
-
291
-
292
-
293
-
294
-
295
-
296
-
297
-
298
-
299
-
300
-
301
-
302
-
303
-
304
-
305
-
306
-
307
-
308
-
309
-
310
-
311
 |
 |

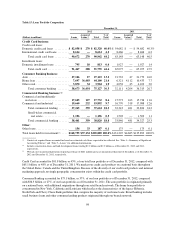
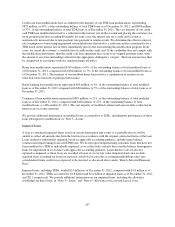
credit losses to properly recognize an estimate of incurred losses on the existing principal balances, which
represents a portion of the total amounts not expected to be collected described above. In 2012, we recorded a
provision for credit losses of $1.2 billion to establish an initial allowance primarily related to these loans. The
allowance was calculated using the same methodology utilized for determining the allowance for our existing
credit card portfolio. The provision for credit losses of $1.2 billion related to these loans is included in the total
provision for credit losses of $4.4 billion recorded in 2012.
Excluded from the amounts above are revolving loans acquired in the 2012 U.S. card acquisition with a fair value
of $471 million that we designated as held for sale at acquisition. We closed on the sale of these receivables early
in the third quarter of 2012.
See “Note 1—Summary of Significant Accounting Policies—Loans” for additional information on our
accounting for loans, including purchased loans. See “Note 5—Loans” and “Note 6—Allowance for Loan and
Lease Losses” for additional information on the credit quality of our loan portfolio.
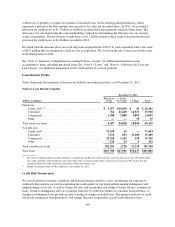
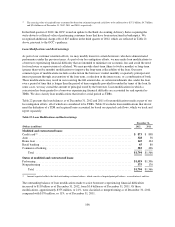
Loan Maturity Profile
Table 16 presents the maturities of loans in our held-for-investment portfolio as of December 31, 2012.
Table 16: Loan Maturity Schedule
December 31, 2012
(Dollars in millions)
Due Up to
1 Year
> 1 Year
to 5 Years > 5 Years Total
Fixed rate:
Credit card(1) (2) ...................................... $ 3,357 $16,699 $ 45 $ 20,101
Consumer .......................................... 762 22,249 12,927 35,938
Commercial ........................................ 1,288 5,880 5,887 13,055
Other .............................................. — — 35 35
Total fixed-rate loans ..................................... 5,407 44,828 18,894 69,129
Variable rate:
Credit card(1) ........................................ 71,639 15 — 71,654
Consumer .......................................... 7,176 833 31,180 39,189
Commercial ........................................ 23,350 2,265 150 25,765
Other .............................................. 128 15 9 152
Total variable-rate loans ................................... 102,293 3,128 31,339 136,760
Total loans ............................................. $107,700 $47,956 $50,233 $205,889
(1) Due to the revolving nature of credit card loans, we report all variable-rate credit card loans as due in one year or less. We report fixed-
rate credit card loans with introductory rates that expire after a certain period of time as due in one year or less. We assume that our
remaining fixed-rate credit card loans will mature within one to three years.
(2) Includes installment loans of $813 million as of December 31, 2012.
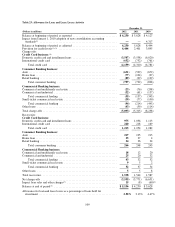
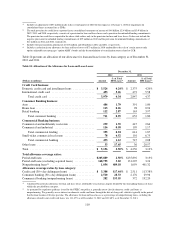
Credit Risk Measurement
We closely monitor economic conditions and loan performance trends to assess and manage our exposure to
credit risk. Key metrics we track in evaluating the credit quality of our loan portfolio include delinquency and
nonperforming asset rates, as well as charge-off rates and our internal risk ratings of larger balance, commercial
loans. Trends in delinquency rates are a primary indicator of credit risk within our consumer loan portfolios, as
changes in delinquency rate provide an early warning of changes in credit losses. The primary indicator of credit
risk in our commercial loan portfolios is risk ratings. Because we generally classify loans that have been
100