Capital One 2012 Annual Report Download - page 151
Download and view the complete annual report
Please find page 151 of the 2012 Capital One annual report below. You can navigate through the pages in the report by either clicking on the pages listed below, or by using the keyword search tool below to find specific information within the annual report.-
 1
1 -
2
-
3
-
4
-
5
-
6
-
7
-
8
-
9
-
10
-
11
-
12
-
13
-
14
-
15
-
16
-
17
-
18
-
19
-
20
-
21
-
22
-
23
-
24
-
25
-
26
-
27
-
28
-
29
-
30
-
31
-
32
-
33
-
34
-
35
-
36
-
37
-
38
-
39
-
40
-
41
-
42
-
43
-
44
-
45
-
46
-
47
-
48
-
49
-
50
-
51
-
52
-
53
-
54
-
55
-
56
-
57
-
58
-
59
-
60
-
61
-
62
-
63
-
64
-
65
-
66
-
67
-
68
-
69
-
70
-
71
-
72
-
73
-
74
-
75
-
76
-
77
-
78
-
79
-
80
-
81
-
82
-
83
-
84
-
85
-
86
-
87
-
88
-
89
-
90
-
91
-
92
-
93
-
94
-
95
-
96
-
97
-
98
-
99
-
100
-
101
-
102
-
103
-
104
-
105
-
106
-
107
-
108
-
109
-
110
-
111
-
112
-
113
-
114
-
115
-
116
-
117
-
118
-
119
-
120
-
121
-
122
-
123
-
124
-
125
-
126
-
127
-
128
-
129
-
130
-
131
-
132
-
133
-
134
-
135
-
136
-
137
-
138
-
139
-
140
-
 141
141 -
 142
142 -
 143
143 -
 144
144 -
 145
145 -
 146
146 -
 147
147 -
 148
148 -
 149
149 -
 150
150 -
 151
151 -
 152
152 -
 153
153 -
 154
154 -
 155
155 -
 156
156 -
 157
157 -
 158
158 -
 159
159 -
 160
160 -
 161
161 -
162
-
163
-
164
-
165
-
166
-
167
-
168
-
169
-
170
-
171
-
172
-
173
-
174
-
175
-
176
-
177
-
178
-
179
-
180
-
181
-
182
-
183
-
184
-
185
-
186
-
187
-
188
-
189
-
190
-
191
-
192
-
193
-
194
-
195
-
196
-
197
-
198
-
199
-
200
-
201
-
202
-
203
-
204
-
205
-
206
-
207
-
208
-
209
-
210
-
211
-
212
-
213
-
214
-
215
-
216
-
217
-
218
-
219
-
220
-
221
-
222
-
223
-
224
-
225
-
226
-
227
-
228
-
229
-
230
-
231
-
232
-
233
-
234
-
235
-
236
-
237
-
238
-
239
-
240
-
241
-
242
-
243
-
244
-
245
-
246
-
247
-
248
-
249
-
250
-
251
-
252
-
253
-
254
-
255
-
256
-
257
-
258
-
259
-
260
-
261
-
262
-
263
-
264
-
265
-
266
-
267
-
268
-
269
-
270
-
271
-
272
-
273
-
274
-
275
-
276
-
277
-
278
-
279
-
280
-
281
-
282
-
283
-
284
-
285
-
286
-
287
-
288
-
289
-
290
-
291
-
292
-
293
-
294
-
295
-
296
-
297
-
298
-
299
-
300
-
301
-
302
-
303
-
304
-
305
-
306
-
307
-
308
-
309
-
310
-
311
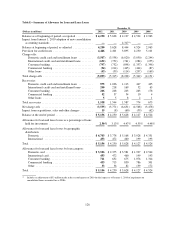
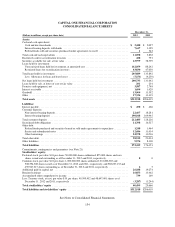
 |
 |

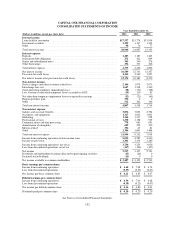
CAPITAL ONE FINANCIAL CORPORATION
CONSOLIDATED STATEMENTS OF INCOME
Year Ended December 31,
(Dollars in millions, except per share data) 2012 2011 2010
Interest income:
Loans held for investment .................................................... $17,537 $13,774 $13,934
Investment securities ........................................................ 1,329 1,137 1,342
Other .................................................................... 98 76 77
Total interest income ........................................................ 18,964 14,987 15,353
Interest expense:
Deposits .................................................................. 1,403 1,187 1,465
Securitized debt obligations ................................................... 271 422 809
Senior and subordinated notes ................................................. 345 300 276
Other borrowings ........................................................... 356 337 346
Total interest expense ....................................................... 2,375 2,246 2,896
Net interest income ......................................................... 16,589 12,741 12,457
Provision for credit losses .................................................... 4,415 2,360 3,907
Net interest income after provision for credit losses ................................ 12,174 10,381 8,550
Non-interest income:
Service charges and other customer-related fees ................................... 2,106 1,979 2,073
Interchange fees, net ........................................................ 1,647 1,318 1,340
Total other-than-temporary impairment losses .................................... (38) (131) (128)
Less: Portion of other-than-temporary losses recorded in AOCI ...................... (14) 110 63
Net other-than-temporary impairment losses recognized in earnings ................... (52) (21) (65)
Bargain purchase gain ....................................................... 594 00
Other .................................................................... 512 262 366
Total non-interest income .................................................... 4,807 3,538 3,714
Non-interest expense:
Salaries and associate benefits ................................................. 3,876 3,023 2,594
Occupancy and equipment .................................................... 1,327 1,025 1,001
Marketing ................................................................. 1,364 1,337 958
Professional services ........................................................ 1,270 1,198 919
Communications and data processing ........................................... 778 681 693
Amortization of intangibles ................................................... 609 222 220
Merger-related ............................................................ 336 45 81
Other .................................................................... 2,386 1,801 1,468
Total non-interest expense .................................................... 11,946 9,332 7,934
Income from continuing operations before income taxes ............................ 5,035 4,587 4,330
Income tax provision ........................................................ 1,301 1,334 1,280
Income from continuing operations, net of tax .................................... 3,734 3,253 3,050
Loss from discontinued operations, net of tax ..................................... (217) (106) (307)
Net income ................................................................ 3,517 3,147 2,743
Dividends and undistributed earnings allocated to participating securities .............. (15) (26) 0
Preferred stock dividends .................................................... (15) 00
Net income available to common stockholders .................................... $ 3,487 $ 3,121 $ 2,743
Basic earnings per common share:
Income from continuing operations ............................................. $ 6.60 $ 7.08 $ 6.74
Loss from discontinued operations ............................................. (0.39) (0.23) (0.67)
Net income per basic common share ............................................ $ 6.21 $ 6.85 $ 6.07
Diluted earnings per common share:
Income from continuing operations ............................................. $ 6.54 $ 7.03 $ 6.68
Loss from discontinued operations ............................................. (0.38) (0.23) (0.67)
Net income per diluted common share .......................................... $ 6.16 $ 6.80 $ 6.01
Dividends paid per common share ............................................. $ 0.20 $ 0.20 $ 0.20
See Notes to Consolidated Financial Statements.
132