Capital One 2012 Annual Report Download - page 268
Download and view the complete annual report
Please find page 268 of the 2012 Capital One annual report below. You can navigate through the pages in the report by either clicking on the pages listed below, or by using the keyword search tool below to find specific information within the annual report.-
 1
1 -
2
-
3
-
4
-
5
-
6
-
7
-
8
-
9
-
10
-
11
-
12
-
13
-
14
-
15
-
16
-
17
-
18
-
19
-
20
-
21
-
22
-
23
-
24
-
25
-
26
-
27
-
28
-
29
-
30
-
31
-
32
-
33
-
34
-
35
-
36
-
37
-
38
-
39
-
40
-
41
-
42
-
43
-
44
-
45
-
46
-
47
-
48
-
49
-
50
-
51
-
52
-
53
-
54
-
55
-
56
-
57
-
58
-
59
-
60
-
61
-
62
-
63
-
64
-
65
-
66
-
67
-
68
-
69
-
70
-
71
-
72
-
73
-
74
-
75
-
76
-
77
-
78
-
79
-
80
-
81
-
82
-
83
-
84
-
85
-
86
-
87
-
88
-
89
-
90
-
91
-
92
-
93
-
94
-
95
-
96
-
97
-
98
-
99
-
100
-
101
-
102
-
103
-
104
-
105
-
106
-
107
-
108
-
109
-
110
-
111
-
112
-
113
-
114
-
115
-
116
-
117
-
118
-
119
-
120
-
121
-
122
-
123
-
124
-
125
-
126
-
127
-
128
-
129
-
130
-
131
-
132
-
133
-
134
-
135
-
136
-
137
-
138
-
139
-
140
-
141
-
142
-
143
-
144
-
145
-
146
-
147
-
148
-
149
-
150
-
151
-
152
-
153
-
154
-
155
-
156
-
157
-
158
-
159
-
160
-
161
-
162
-
163
-
164
-
165
-
166
-
167
-
168
-
169
-
170
-
171
-
172
-
173
-
174
-
175
-
176
-
177
-
178
-
179
-
180
-
181
-
182
-
183
-
184
-
185
-
186
-
187
-
188
-
189
-
190
-
191
-
192
-
193
-
194
-
195
-
196
-
197
-
198
-
199
-
200
-
201
-
202
-
203
-
204
-
205
-
206
-
207
-
208
-
209
-
210
-
211
-
212
-
213
-
214
-
215
-
216
-
217
-
218
-
219
-
220
-
221
-
222
-
223
-
224
-
225
-
226
-
227
-
228
-
229
-
230
-
231
-
232
-
233
-
234
-
235
-
236
-
237
-
238
-
239
-
240
-
241
-
242
-
243
-
244
-
245
-
246
-
247
-
248
-
249
-
250
-
251
-
252
-
253
-
254
-
255
-
256
-
257
-
 258
258 -
 259
259 -
 260
260 -
 261
261 -
 262
262 -
 263
263 -
 264
264 -
 265
265 -
 266
266 -
 267
267 -
 268
268 -
 269
269 -
 270
270 -
 271
271 -
 272
272 -
 273
273 -
 274
274 -
 275
275 -
 276
276 -
 277
277 -
 278
278 -
279
-
280
-
281
-
282
-
283
-
284
-
285
-
286
-
287
-
288
-
289
-
290
-
291
-
292
-
293
-
294
-
295
-
296
-
297
-
298
-
299
-
300
-
301
-
302
-
303
-
304
-
305
-
306
-
307
-
308
-
309
-
310
-
311
 |
 |
CAPITAL ONE FINANCIAL CORPORATION
NOTES TO CONSOLIDATED FINANCIAL STATEMENTS—(Continued)
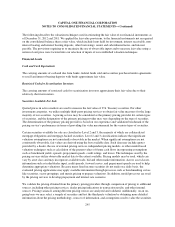
on the sale and securitization of loans; unallocated corporate expenses that do not directly support the
operations of the business segments or for which the business segments are not considered financially
accountable in evaluating their performance, such as acquisition and restructuring charges; provisions for
representation and warranty reserves related to continuing operations; certain material items that are non-
recurring in nature; and offsets related to certain line-item reclassifications.
Basis of Presentation
We report the results of each of our business segments on a continuing operations basis. See “Note 3—
Discontinued Operations” for a discussion of discontinued operations. The results of our individual businesses
reflect the manner in which management evaluates performance and makes decisions about funding our
operations and allocating resources. We use an internal management and reporting process to derive our business
segment results. We refer to the business segment results derived from our internal management accounting and
reporting process as our “managed” presentation, which differs in some cases, as described below, from our
reported results prepared based on U.S. GAAP. There is no comprehensive, authoritative body of guidance for
management accounting equivalent to U.S. GAAP; therefore, the managed basis presentation of our business
segment results may not be comparable to similar information provided by other financial service companies. In
addition, our individual business segment results should not be used as a substitute for comparable results
determined in accordance with U.S. GAAP.
Business Segment Reporting Methodology
The results of our business segments are intended to reflect each segment as if it were a stand-alone business.
Our internal management and reporting process used to derive our segment results employs various allocation
methodologies, including funds transfer pricing, to assign certain balance sheet assets, deposits and other
liabilities and their related revenue and expenses directly or indirectly attributable to each business segment.
Total interest income and net fees are directly attributable to the segment in which they are reported. The net
interest income of each segment reflects the results of our funds transfer pricing process, which is primarily
based on a matched maturity method that takes into consideration market rates. Our funds transfer pricing
process provides a funds credit for sources of funds, such as deposits generated by our Consumer Banking and
Commercial Banking businesses, and a funds charge for the use of funds by each segment. The allocation process
is unique to each business segment and acquired businesses. Due to the integrated nature of our business
segments, estimates and judgments have been made in allocating certain revenue and expense items.
Transactions between segments are based on specific criteria or approximate third-party rates. We regularly
assess the assumptions, methodologies and reporting classifications used for segment reporting, which may result
in the implementation of refinements or changes in future periods.
Following is additional information on the principles and methodologies used in preparing our business segment
results.
•Net interest income: Interest income from loans held for investment and interest expense from deposits and
other interest-bearing liabilities are reflected within each applicable business segment. Because funding and
asset/liability management are managed centrally by our Corporate Treasury Group, net interest income for
our business segments also includes the results of a funds transfer pricing process that is intended to allocate
a cost of funds used or credit for funds provided to all business segment assets and liabilities, respectively,
using a matched funding concept. Also, taxable-equivalent benefit of tax-exempt products is allocated to
each business unit with a corresponding increase in income tax expense.
249