Capital One 2012 Annual Report Download - page 117
Download and view the complete annual report
Please find page 117 of the 2012 Capital One annual report below. You can navigate through the pages in the report by either clicking on the pages listed below, or by using the keyword search tool below to find specific information within the annual report.-
 1
1 -
2
-
3
-
4
-
5
-
6
-
7
-
8
-
9
-
10
-
11
-
12
-
13
-
14
-
15
-
16
-
17
-
18
-
19
-
20
-
21
-
22
-
23
-
24
-
25
-
26
-
27
-
28
-
29
-
30
-
31
-
32
-
33
-
34
-
35
-
36
-
37
-
38
-
39
-
40
-
41
-
42
-
43
-
44
-
45
-
46
-
47
-
48
-
49
-
50
-
51
-
52
-
53
-
54
-
55
-
56
-
57
-
58
-
59
-
60
-
61
-
62
-
63
-
64
-
65
-
66
-
67
-
68
-
69
-
70
-
71
-
72
-
73
-
74
-
75
-
76
-
77
-
78
-
79
-
80
-
81
-
82
-
83
-
84
-
85
-
86
-
87
-
88
-
89
-
90
-
91
-
92
-
93
-
94
-
95
-
96
-
97
-
98
-
99
-
100
-
101
-
102
-
103
-
104
-
105
-
106
-
 107
107 -
 108
108 -
 109
109 -
 110
110 -
 111
111 -
 112
112 -
 113
113 -
 114
114 -
 115
115 -
 116
116 -
 117
117 -
 118
118 -
 119
119 -
 120
120 -
 121
121 -
 122
122 -
 123
123 -
 124
124 -
 125
125 -
 126
126 -
 127
127 -
128
-
129
-
130
-
131
-
132
-
133
-
134
-
135
-
136
-
137
-
138
-
139
-
140
-
141
-
142
-
143
-
144
-
145
-
146
-
147
-
148
-
149
-
150
-
151
-
152
-
153
-
154
-
155
-
156
-
157
-
158
-
159
-
160
-
161
-
162
-
163
-
164
-
165
-
166
-
167
-
168
-
169
-
170
-
171
-
172
-
173
-
174
-
175
-
176
-
177
-
178
-
179
-
180
-
181
-
182
-
183
-
184
-
185
-
186
-
187
-
188
-
189
-
190
-
191
-
192
-
193
-
194
-
195
-
196
-
197
-
198
-
199
-
200
-
201
-
202
-
203
-
204
-
205
-
206
-
207
-
208
-
209
-
210
-
211
-
212
-
213
-
214
-
215
-
216
-
217
-
218
-
219
-
220
-
221
-
222
-
223
-
224
-
225
-
226
-
227
-
228
-
229
-
230
-
231
-
232
-
233
-
234
-
235
-
236
-
237
-
238
-
239
-
240
-
241
-
242
-
243
-
244
-
245
-
246
-
247
-
248
-
249
-
250
-
251
-
252
-
253
-
254
-
255
-
256
-
257
-
258
-
259
-
260
-
261
-
262
-
263
-
264
-
265
-
266
-
267
-
268
-
269
-
270
-
271
-
272
-
273
-
274
-
275
-
276
-
277
-
278
-
279
-
280
-
281
-
282
-
283
-
284
-
285
-
286
-
287
-
288
-
289
-
290
-
291
-
292
-
293
-
294
-
295
-
296
-
297
-
298
-
299
-
300
-
301
-
302
-
303
-
304
-
305
-
306
-
307
-
308
-
309
-
310
-
311
 |
 |

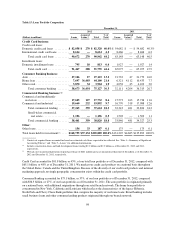
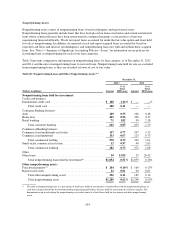
Table 15: Loan Portfolio Composition
December 31,
(Dollars in millions)
2012 2011
Loans
Acquired
Loans(1) Total
% of
Total Loans
Acquired
Loans(1) Total
% of
Total
Credit Card business:
Credit card loans:
Domestic credit card loans ..........$ 82,058 $ 270 $ 82,328 40.0%$ 54,682 $ — $ 54,682 40.3%
International credit card loans ........ 8,614 — 8,614 4.2 8,466 — 8,466 6.2
Total credit card loans .......... 90,672 270 90,942 44.2 63,148 — 63,148 46.5
Installment loans:
Domestic installment loans .......... 795 18 813 0.4 1,927 — 1,927 1.4
Total credit card ............... 91,467 288 91,755 44.6 65,075 — 65,075 47.9
Consumer Banking business:
Auto ............................ 27,106 17 27,123 13.2 21,732 47 21,779 16.0
Home loan ....................... 7,697 36,403 44,100 21.4 6,321 4,112 10,433 7.7
Other retail ....................... 3,870 34 3,904 1.9 4,058 45 4,103 3.0
Total consumer banking ........ 38,673 36,454 75,127 36.5 32,111 4,204 36,315 26.7
Commercial Banking business:(2)
Commercial and multifamily
real estate ...................... 17,605 127 17,732 8.6 15,573 163 15,736 11.6
Commercial and industrial .......... 19,660 232 19,892 9.7 16,770 318 17,088 12.6
Total commercial lending ....... 37,265 359 37,624 18.3 32,343 481 32,824 24.2
Small-ticket commercial
real estate .................. 1,196 — 1,196 0.5 1,503 — 1,503 1.1
Total commercial banking ....... 38,461 359 38,820 18.8 33,846 481 34,327 25.3
Other:
Other loans ....................... 154 33 187 0.1 175 — 175 0.1
Total loans held for investment(3) .....$168,755 $37,134 $205,889 100.0%$131,207 $4,685 $135,892 100.0%
(1) Consists of acquired loans accounted for based on estimated cash flows expected to be collected. See “Note 1—Summary of Significant
Accounting Policies” and “Note 5—Loans” for additional information.
(2) Includes construction loans and land development loans totaling $2.1 billion and $2.2 billion as of December 31, 2012 and 2011,
respectively.
(3) We had a net unamortized premium on purchased loans of $461 million and a net unamortized discount of $4 million as of December 31,
2012 and December 31, 2011, respectively.
Credit Card accounted for $91.8 billion, or 45%, of our total loan portfolio as of December 31, 2012, compared with
$65.1 billion, or 48% as of December 31, 2011. We market our credit card products on a national basis throughout
the United States, Canada and the United Kingdom. Because of the diversity of our credit card products and national
marketing approach, no single geographic concentration exists within the credit card portfolio.
Consumer Banking accounted for $75.1 billion, or 37%, of our loan portfolio as of December 31, 2012, compared
with $36.3 billion, or 27%, of our loan portfolio as of December 31, 2011. The auto portfolio is originated primarily
on a national basis, with additional originations through our retail branch network. The home loan portfolio is
concentrated in New York, California and Louisiana which reflects the characteristics of the legacy Hibernia,
North Fork and Chevy Chase Bank portfolios that comprise the majority of our home loans. Retail banking includes
small business loans and other consumer lending products originated through our branch network.
98