Capital One 2012 Annual Report Download - page 126
Download and view the complete annual report
Please find page 126 of the 2012 Capital One annual report below. You can navigate through the pages in the report by either clicking on the pages listed below, or by using the keyword search tool below to find specific information within the annual report.-
 1
1 -
2
-
3
-
4
-
5
-
6
-
7
-
8
-
9
-
10
-
11
-
12
-
13
-
14
-
15
-
16
-
17
-
18
-
19
-
20
-
21
-
22
-
23
-
24
-
25
-
26
-
27
-
28
-
29
-
30
-
31
-
32
-
33
-
34
-
35
-
36
-
37
-
38
-
39
-
40
-
41
-
42
-
43
-
44
-
45
-
46
-
47
-
48
-
49
-
50
-
51
-
52
-
53
-
54
-
55
-
56
-
57
-
58
-
59
-
60
-
61
-
62
-
63
-
64
-
65
-
66
-
67
-
68
-
69
-
70
-
71
-
72
-
73
-
74
-
75
-
76
-
77
-
78
-
79
-
80
-
81
-
82
-
83
-
84
-
85
-
86
-
87
-
88
-
89
-
90
-
91
-
92
-
93
-
94
-
95
-
96
-
97
-
98
-
99
-
100
-
101
-
102
-
103
-
104
-
105
-
106
-
107
-
108
-
109
-
110
-
111
-
112
-
113
-
114
-
115
-
 116
116 -
 117
117 -
 118
118 -
 119
119 -
 120
120 -
 121
121 -
 122
122 -
 123
123 -
 124
124 -
 125
125 -
 126
126 -
 127
127 -
 128
128 -
 129
129 -
 130
130 -
 131
131 -
 132
132 -
 133
133 -
 134
134 -
 135
135 -
 136
136 -
137
-
138
-
139
-
140
-
141
-
142
-
143
-
144
-
145
-
146
-
147
-
148
-
149
-
150
-
151
-
152
-
153
-
154
-
155
-
156
-
157
-
158
-
159
-
160
-
161
-
162
-
163
-
164
-
165
-
166
-
167
-
168
-
169
-
170
-
171
-
172
-
173
-
174
-
175
-
176
-
177
-
178
-
179
-
180
-
181
-
182
-
183
-
184
-
185
-
186
-
187
-
188
-
189
-
190
-
191
-
192
-
193
-
194
-
195
-
196
-
197
-
198
-
199
-
200
-
201
-
202
-
203
-
204
-
205
-
206
-
207
-
208
-
209
-
210
-
211
-
212
-
213
-
214
-
215
-
216
-
217
-
218
-
219
-
220
-
221
-
222
-
223
-
224
-
225
-
226
-
227
-
228
-
229
-
230
-
231
-
232
-
233
-
234
-
235
-
236
-
237
-
238
-
239
-
240
-
241
-
242
-
243
-
244
-
245
-
246
-
247
-
248
-
249
-
250
-
251
-
252
-
253
-
254
-
255
-
256
-
257
-
258
-
259
-
260
-
261
-
262
-
263
-
264
-
265
-
266
-
267
-
268
-
269
-
270
-
271
-
272
-
273
-
274
-
275
-
276
-
277
-
278
-
279
-
280
-
281
-
282
-
283
-
284
-
285
-
286
-
287
-
288
-
289
-
290
-
291
-
292
-
293
-
294
-
295
-
296
-
297
-
298
-
299
-
300
-
301
-
302
-
303
-
304
-
305
-
306
-
307
-
308
-
309
-
310
-
311
 |
 |
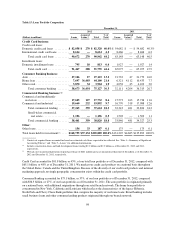
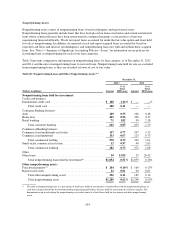
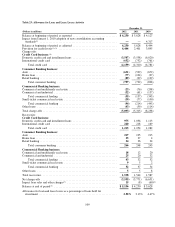
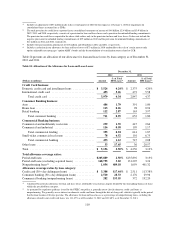
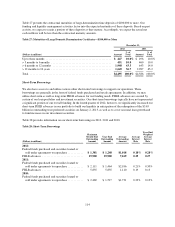
Credit card loan modifications have accounted for the majority of our TDR loan modifications, representing
$873 million, or 49%, of the outstanding balance of total TDR loans as of December 31, 2012, and $898 million,
or 57%, of the outstanding balance of total TDR loans as of December 31, 2011. The vast majority of our credit
card TDR loan modifications involve a reduction in the interest rate on the account and placing the customer on a
fixed payment plan not exceeding 60 months. In some cases, the interest rate on a credit card account is
automatically increased due to non-payment, late payment or similar events. We determine the effective interest
rate for purposes of measuring impairment on modified loans that involve a reduction and are considered to be a
TDR based on the interest rate in effect immediately prior to the loan entering the modification program. In all
cases, we cancel the customer’s available line of credit on the credit card. If the cardholder does not comply with
the modified payment terms, then the credit card loan agreement may revert to its original payment terms, with
the amount of any loan outstanding reflected in the appropriate delinquency category. The loan amount may then
be charged-off in accordance with our standard charge-off policy.
Home loan modifications represented $145 million, or 8%, of the outstanding balance of total modified loans as
of December 31, 2012, compared with $104 million, or 7%, of the outstanding balance of total modified loans as
of December 31, 2011. The majority of our modified home loans involve a combination of an interest rate
reduction, term extension or principal forbearance.
Retail banking loan modifications represented $65 million, or 4%, of the outstanding balance of total modified
loans as of December 31, 2012 compared with $80 million, or 5%, of the outstanding balance of total loans as of
December 31, 2011.
Commercial loan modifications represented $383 million, or 21%, of the outstanding balance of total modified
loans as of December 31, 2012, compared with $426 million, or 27%, of the outstanding balance of total
modified loans as of December 31, 2011. The vast majority of modified commercial loans include a reduction in
interest rate or a term extension.
We provide additional information on modified loans accounted for as TDRs, including the performance of those
loans subsequent to modification, in “Note 5—Loans.”
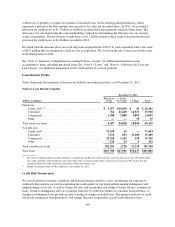
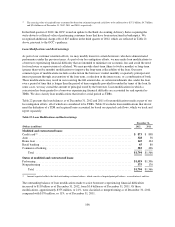
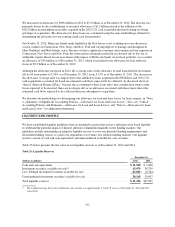
Impaired Loans
A loan is considered impaired when, based on current information and events, it is probable that we will be
unable to collect all amounts due from the borrower in accordance with the original contractual terms of the loan.
Loans defined as individually impaired, based on applicable accounting guidance, include larger balance
commercial nonperforming loans and TDR loans. We do not report nonperforming consumer loans that have not
been modified in a TDR as individually impaired, as we collectively evaluate these smaller-balance homogenous
loans for impairment in accordance with applicable accounting guidance. Loans held for sale are also not
reported as impaired, as these loans are recorded at lower of cost or fair value. Impaired loans also exclude
acquired loans accounted for based on expected cash flows because this accounting methodology takes into
consideration future credit losses expected to be incurred, as discussed above under “Item 6. Selected Financial
Data.”
Impaired loans, including TDRs, totaled $2.0 billion as of December 31, 2012, compared with $1.8 billion as of
December 31, 2011. TDRs accounted for $1.8 billion and $1.6 billion of impaired loans as of December 31, 2012
and 2011, respectively. We provide additional information on our impaired loans, including the allowance
established for these loans, in “Note 5—Loans” and “Note 6—Allowance for Loan and Lease Losses.”
107