Capital One 2012 Annual Report Download - page 145
Download and view the complete annual report
Please find page 145 of the 2012 Capital One annual report below. You can navigate through the pages in the report by either clicking on the pages listed below, or by using the keyword search tool below to find specific information within the annual report.-
 1
1 -
2
-
3
-
4
-
5
-
6
-
7
-
8
-
9
-
10
-
11
-
12
-
13
-
14
-
15
-
16
-
17
-
18
-
19
-
20
-
21
-
22
-
23
-
24
-
25
-
26
-
27
-
28
-
29
-
30
-
31
-
32
-
33
-
34
-
35
-
36
-
37
-
38
-
39
-
40
-
41
-
42
-
43
-
44
-
45
-
46
-
47
-
48
-
49
-
50
-
51
-
52
-
53
-
54
-
55
-
56
-
57
-
58
-
59
-
60
-
61
-
62
-
63
-
64
-
65
-
66
-
67
-
68
-
69
-
70
-
71
-
72
-
73
-
74
-
75
-
76
-
77
-
78
-
79
-
80
-
81
-
82
-
83
-
84
-
85
-
86
-
87
-
88
-
89
-
90
-
91
-
92
-
93
-
94
-
95
-
96
-
97
-
98
-
99
-
100
-
101
-
102
-
103
-
104
-
105
-
106
-
107
-
108
-
109
-
110
-
111
-
112
-
113
-
114
-
115
-
116
-
117
-
118
-
119
-
120
-
121
-
122
-
123
-
124
-
125
-
126
-
127
-
128
-
129
-
130
-
131
-
132
-
133
-
134
-
 135
135 -
 136
136 -
 137
137 -
 138
138 -
 139
139 -
 140
140 -
 141
141 -
 142
142 -
 143
143 -
 144
144 -
 145
145 -
 146
146 -
 147
147 -
 148
148 -
 149
149 -
 150
150 -
 151
151 -
 152
152 -
 153
153 -
 154
154 -
 155
155 -
156
-
157
-
158
-
159
-
160
-
161
-
162
-
163
-
164
-
165
-
166
-
167
-
168
-
169
-
170
-
171
-
172
-
173
-
174
-
175
-
176
-
177
-
178
-
179
-
180
-
181
-
182
-
183
-
184
-
185
-
186
-
187
-
188
-
189
-
190
-
191
-
192
-
193
-
194
-
195
-
196
-
197
-
198
-
199
-
200
-
201
-
202
-
203
-
204
-
205
-
206
-
207
-
208
-
209
-
210
-
211
-
212
-
213
-
214
-
215
-
216
-
217
-
218
-
219
-
220
-
221
-
222
-
223
-
224
-
225
-
226
-
227
-
228
-
229
-
230
-
231
-
232
-
233
-
234
-
235
-
236
-
237
-
238
-
239
-
240
-
241
-
242
-
243
-
244
-
245
-
246
-
247
-
248
-
249
-
250
-
251
-
252
-
253
-
254
-
255
-
256
-
257
-
258
-
259
-
260
-
261
-
262
-
263
-
264
-
265
-
266
-
267
-
268
-
269
-
270
-
271
-
272
-
273
-
274
-
275
-
276
-
277
-
278
-
279
-
280
-
281
-
282
-
283
-
284
-
285
-
286
-
287
-
288
-
289
-
290
-
291
-
292
-
293
-
294
-
295
-
296
-
297
-
298
-
299
-
300
-
301
-
302
-
303
-
304
-
305
-
306
-
307
-
308
-
309
-
310
-
311
 |
 |

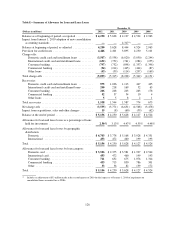
Table E—Summary of Allowance for Loan and Lease Losses
December 31,
(Dollars in millions) 2012 2011 2010 2009 2008
Balance as of beginning of period, as reported ............ $ 4,250 $ 5,628 $ 4,127 $ 4,524 $ 2,963
Impact from January 1, 2010 adoption of new consolidation
accounting standards .............................. —— 4,317(1) ——
Balance at beginning of period, as adjusted .............. 4,250 5,628 8,444 4,524 2,963
Provision for credit losses ............................ 4,446 2,401 3,895 4,230 5,101
Charge-offs:
Domestic credit card and installment loans .......... (3,507) (3,558) (6,020) (3,050) (2,244)
International credit card and installment loans ........ (652) (752) (761) (284) (255)
Consumer banking .............................. (797) (732) (898) (1,357) (1,396)
Commercial banking ............................ (94) (214) (445) (444) (87)
Other loans ................................... (43) (59) (114) (207) (169)
Total charge-offs ................................... (5,093) (5,315) (8,238) (5,342) (4,151)
Recoveries:
Domestic credit card and installment loans .......... 975 1,036 1,113 447 425
International credit card and installment loans ........ 240 218 169 52 65
Consumer banking .............................. 266 248 243 263 178
Commercial banking ............................ 52 37 54 10 4
Other loans ................................... 55821
Total recoveries .................................... 1,538 1,544 1,587 774 673
Net charge-offs .................................... (3,555) (3,771) (6,651) (4,568) (3,478)
Impact from acquisitions, sales and other changes ......... 15 (8) (60) (59) (62)
Balance at the end of period .......................... $ 5,156 $ 4,250 $ 5,628 $ 4,127 $ 4,524
Allowance for loan and lease losses as a percentage of loans
held for investment ............................... 2.50% 3.13% 4.47% 4.55% 4.48%
Allowance for loan and lease losses by geographic
distribution:
Domestic ..................................... $ 4,703 $ 3,778 $ 5,168 $ 3,928 $ 4,331
International .................................. 453 472 460 199 193
Total ............................................ $ 5,156 $ 4,250 $ 5,628 $ 4,127 $ 4,524
Allowance for loan and lease losses by loan category:
Domestic card ................................. $ 3,526 $ 2,375 $ 3,581 $ 1,927 $ 2,544
International card ............................... 453 472 460 199 193
Consumer banking .............................. 711 652 675 1,076 1,314
Commercial banking ............................ 433 715 830 786 301
Other ........................................ 33 36 82 139 172
Total ............................................ $ 5,156 $ 4,250 $ 5,628 $ 4,127 $ 4,524
(1) Includes an adjustment of $53 million made in the second quarter of 2010 for the impact as of January 1, 2010 of impairment on
consolidated loans accounted for as TDRs.
126