Capital One 2012 Annual Report Download - page 79
Download and view the complete annual report
Please find page 79 of the 2012 Capital One annual report below. You can navigate through the pages in the report by either clicking on the pages listed below, or by using the keyword search tool below to find specific information within the annual report.-
 1
1 -
2
-
3
-
4
-
5
-
6
-
7
-
8
-
9
-
10
-
11
-
12
-
13
-
14
-
15
-
16
-
17
-
18
-
19
-
20
-
21
-
22
-
23
-
24
-
25
-
26
-
27
-
28
-
29
-
30
-
31
-
32
-
33
-
34
-
35
-
36
-
37
-
38
-
39
-
40
-
41
-
42
-
43
-
44
-
45
-
46
-
47
-
48
-
49
-
50
-
51
-
52
-
53
-
54
-
55
-
56
-
57
-
58
-
59
-
60
-
61
-
62
-
63
-
64
-
65
-
66
-
67
-
68
-
 69
69 -
 70
70 -
 71
71 -
 72
72 -
 73
73 -
 74
74 -
 75
75 -
 76
76 -
 77
77 -
 78
78 -
 79
79 -
 80
80 -
 81
81 -
 82
82 -
 83
83 -
 84
84 -
 85
85 -
 86
86 -
 87
87 -
 88
88 -
 89
89 -
90
-
91
-
92
-
93
-
94
-
95
-
96
-
97
-
98
-
99
-
100
-
101
-
102
-
103
-
104
-
105
-
106
-
107
-
108
-
109
-
110
-
111
-
112
-
113
-
114
-
115
-
116
-
117
-
118
-
119
-
120
-
121
-
122
-
123
-
124
-
125
-
126
-
127
-
128
-
129
-
130
-
131
-
132
-
133
-
134
-
135
-
136
-
137
-
138
-
139
-
140
-
141
-
142
-
143
-
144
-
145
-
146
-
147
-
148
-
149
-
150
-
151
-
152
-
153
-
154
-
155
-
156
-
157
-
158
-
159
-
160
-
161
-
162
-
163
-
164
-
165
-
166
-
167
-
168
-
169
-
170
-
171
-
172
-
173
-
174
-
175
-
176
-
177
-
178
-
179
-
180
-
181
-
182
-
183
-
184
-
185
-
186
-
187
-
188
-
189
-
190
-
191
-
192
-
193
-
194
-
195
-
196
-
197
-
198
-
199
-
200
-
201
-
202
-
203
-
204
-
205
-
206
-
207
-
208
-
209
-
210
-
211
-
212
-
213
-
214
-
215
-
216
-
217
-
218
-
219
-
220
-
221
-
222
-
223
-
224
-
225
-
226
-
227
-
228
-
229
-
230
-
231
-
232
-
233
-
234
-
235
-
236
-
237
-
238
-
239
-
240
-
241
-
242
-
243
-
244
-
245
-
246
-
247
-
248
-
249
-
250
-
251
-
252
-
253
-
254
-
255
-
256
-
257
-
258
-
259
-
260
-
261
-
262
-
263
-
264
-
265
-
266
-
267
-
268
-
269
-
270
-
271
-
272
-
273
-
274
-
275
-
276
-
277
-
278
-
279
-
280
-
281
-
282
-
283
-
284
-
285
-
286
-
287
-
288
-
289
-
290
-
291
-
292
-
293
-
294
-
295
-
296
-
297
-
298
-
299
-
300
-
301
-
302
-
303
-
304
-
305
-
306
-
307
-
308
-
309
-
310
-
311
 |
 |

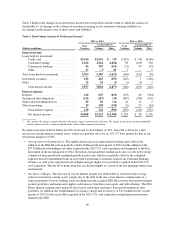
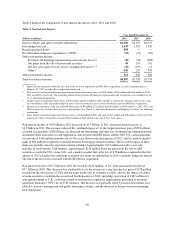
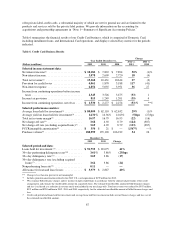
Table 3 displays the change in our net interest income between periods and the extent to which the variance is
attributable to: (i) changes in the volume of our interest-earning assets and interest-bearing liabilities or
(ii) changes in the interest rates of these assets and liabilities.
Table 3: Rate/Volume Analysis of Net Interest Income(1)
2012 vs. 2011 2011 vs. 2010
Total
Variance
Variance Due to Total
Variance
Variance Due to
(Dollars in millions) Volume Rate Volume Rate
Interest income:
Loans held for investment:
Credit card ........................ $2,524 $2,561 $ (37) $(242) $ (76) $(166)
Consumer banking ................. 1,166 2,624 (1,458) 98 (100) 198
Commercial banking ................ 46 207 (161) (21) 74 (95)
Other ............................ 27 (7) 34 5 —5
Total loans held for investment ............ 3,763 5,385 (1,622) (160) (102) (58)
Investment securities .................... 192 445 (253) (205) 1 (206)
Other ................................ 22 24 (2) (1) (3) 2
Total interest income ................ 3,977 5,854 (1,877) (366) (105) (261)
Interest expense:
Deposits .............................. 216 635 (419) (278) 66 (344)
Securitized debt obligations .............. (151) (127) (24) (387) (286) (101)
Senior and subordinated notes ............ 45 56 (11) 24 22 2
Other borrowings ...................... 19 158 (139) (9) 55 (64)
Total interest expense ............... 129 722 (593) (650) (143) (507)
Net interest income ................. $3,848 $5,132 $(1,284) $ 284 $ 38 $ 246
(1) We calculate the change in interest income and interest expense separately for each item. The change in net interest income attributable
to both volume and rates is allocated based on the relative dollar amount of each item.
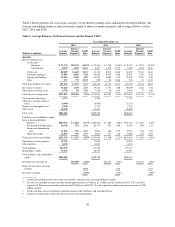
Net interest income of $16.6 billion for 2012 increased by $3.8 billion, or 30%, from 2011, driven by a 46%
increase in average interest-earning assets, which was partially offset by an 11% (77 basis points) decline in our
net interest margin to 6.50%.
•Average Interest-Earning Assets: The significant increase in average interest-earning assets reflects the
addition of the ING Direct loan portfolio of $40.4 billion in the first quarter of 2012 and the addition of the
$27.8 billion in outstanding receivables acquired in the 2012 U.S. card acquisition and designated as held for
investment in the second quarter of 2012. Growth in average-interest earning assets also was driven by strong
commercial loan growth and continued growth in auto loans, which was partially offset by the continued
expected run-off of installment loans in our Credit Card business and home loans in our Consumer Banking
business, as well as the expected run-off of higher-margin, higher-loss receivables acquired in the 2012 U.S.
card acquisition. The run-off of home loans has accelerated slightly as a result of the low mortgage interest rate
environment.
•Net Interest Margin: The decrease in our net interest margin was attributable to a decline in the average
yield on our interest-earning assets, largely due to the shift in the mix of our interest-earning assets to a
larger proportion of lower yielding assets resulting from the acquired ING Direct home loan and investment
security portfolios and temporarily higher cash balances from the recent equity and debt offerings. The ING
Direct interest-earning assets generally have lower yields than our legacy loan and investment security
portfolios. In addition, the establishment of a finance charge and fee reserve of $174 million in the second
quarter of 2012 for the receivables acquired in the 2012 U.S. card acquisition and premium amortization
related to the ING
60