Capital One 2012 Annual Report Download - page 81
Download and view the complete annual report
Please find page 81 of the 2012 Capital One annual report below. You can navigate through the pages in the report by either clicking on the pages listed below, or by using the keyword search tool below to find specific information within the annual report.-
 1
1 -
2
-
3
-
4
-
5
-
6
-
7
-
8
-
9
-
10
-
11
-
12
-
13
-
14
-
15
-
16
-
17
-
18
-
19
-
20
-
21
-
22
-
23
-
24
-
25
-
26
-
27
-
28
-
29
-
30
-
31
-
32
-
33
-
34
-
35
-
36
-
37
-
38
-
39
-
40
-
41
-
42
-
43
-
44
-
45
-
46
-
47
-
48
-
49
-
50
-
51
-
52
-
53
-
54
-
55
-
56
-
57
-
58
-
59
-
60
-
61
-
62
-
63
-
64
-
65
-
66
-
67
-
68
-
69
-
70
-
 71
71 -
 72
72 -
 73
73 -
 74
74 -
 75
75 -
 76
76 -
 77
77 -
 78
78 -
 79
79 -
 80
80 -
 81
81 -
 82
82 -
 83
83 -
 84
84 -
 85
85 -
 86
86 -
 87
87 -
 88
88 -
 89
89 -
 90
90 -
 91
91 -
92
-
93
-
94
-
95
-
96
-
97
-
98
-
99
-
100
-
101
-
102
-
103
-
104
-
105
-
106
-
107
-
108
-
109
-
110
-
111
-
112
-
113
-
114
-
115
-
116
-
117
-
118
-
119
-
120
-
121
-
122
-
123
-
124
-
125
-
126
-
127
-
128
-
129
-
130
-
131
-
132
-
133
-
134
-
135
-
136
-
137
-
138
-
139
-
140
-
141
-
142
-
143
-
144
-
145
-
146
-
147
-
148
-
149
-
150
-
151
-
152
-
153
-
154
-
155
-
156
-
157
-
158
-
159
-
160
-
161
-
162
-
163
-
164
-
165
-
166
-
167
-
168
-
169
-
170
-
171
-
172
-
173
-
174
-
175
-
176
-
177
-
178
-
179
-
180
-
181
-
182
-
183
-
184
-
185
-
186
-
187
-
188
-
189
-
190
-
191
-
192
-
193
-
194
-
195
-
196
-
197
-
198
-
199
-
200
-
201
-
202
-
203
-
204
-
205
-
206
-
207
-
208
-
209
-
210
-
211
-
212
-
213
-
214
-
215
-
216
-
217
-
218
-
219
-
220
-
221
-
222
-
223
-
224
-
225
-
226
-
227
-
228
-
229
-
230
-
231
-
232
-
233
-
234
-
235
-
236
-
237
-
238
-
239
-
240
-
241
-
242
-
243
-
244
-
245
-
246
-
247
-
248
-
249
-
250
-
251
-
252
-
253
-
254
-
255
-
256
-
257
-
258
-
259
-
260
-
261
-
262
-
263
-
264
-
265
-
266
-
267
-
268
-
269
-
270
-
271
-
272
-
273
-
274
-
275
-
276
-
277
-
278
-
279
-
280
-
281
-
282
-
283
-
284
-
285
-
286
-
287
-
288
-
289
-
290
-
291
-
292
-
293
-
294
-
295
-
296
-
297
-
298
-
299
-
300
-
301
-
302
-
303
-
304
-
305
-
306
-
307
-
308
-
309
-
310
-
311
 |
 |

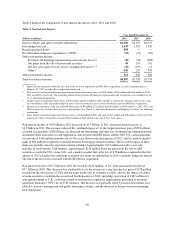
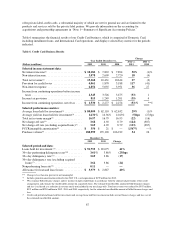
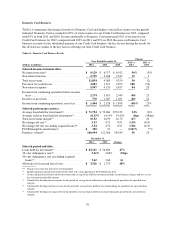
Table 4 displays the components of non-interest income for 2012, 2011 and 2010.
Table 4: Non-Interest Income
Year Ended December 31,
(Dollars in millions) 2012 2011 2010
Service charges and other customer-related fees ........................... $2,106 $1,979 $2,073
Interchange fees, net ................................................. 1,647 1,318 1,340
Bargain purchase gain(1) .............................................. 594 ——
Net other-than-temporary impairment (“OTTI”) ........................... (52) (21) (65)
Other non-interest income: ............................................
Provision for mortgage representation and warranty losses(2) ............. (42) (43) (204)
Net gains from the sale of investment securities ....................... 45 259 141
Net fair value gains (losses) on free-standing derivatives(3) (4) ............. (36) (197) 51
Other(5) ....................................................... 545 243 378
Other non-interest income ............................................ 512 262 366
Total non-interest income ............................................. $4,807 $3,538 $3,714
(1) Represents the amount by which the fair value of the net assets acquired in the ING Direct acquisition, as of the acquisition date of
February 17, 2012, exceeded the consideration transferred.
(2) We recorded a total provision for mortgage representation and warranty losses of $349 million, $212 million and $636 million in 2012,
2011 and 2010, respectively. The remaining portion of the provision for mortgage representation and warranty losses is included, net of
tax, in discontinued operations.
(3) Includes mark-to-market derivative losses of $78 million and $277 million in 2012 and 2011, respectively, related to interest-rate swaps
we entered into in 2011 to partially hedge the interest rate risk of the net assets associated with the expected ING Direct acquisition.
(4) Excludes net cumulative credit risk valuation adjustments of $9 million, $23 million and $20 million as of December 31, 2012, 2011, and
2010, respectively, related to derivatives in a gain position. See “Note 11—Derivative Instruments and Hedging Activities” for additional
information.
(5) Other includes derivative hedge ineffectiveness losses of $36 million in 2012 and gains of $15 million and $50 million in 2011 and 2010,
respectively. Other also includes income of $162 million in 2012 related to the sale of Visa stock shares.
Non-interest income of $4.8 billion in 2012 increased by $1.3 billion, or 36%, from non-interest income of
$3.5 billion in 2011. This increase reflected the combined impact of: (i) the bargain purchase gain of $594 million
recorded at acquisition of ING Direct; (ii) increased net interchange and other fees resulting from continued growth
and market share from new account originations, due in part to the ING Direct and the 2012 U.S. card acquisitions;
(iii) income of $162 million from the sale of Visa stock shares in the first quarter of 2012; and (iv) mark-to-market
gains of $85 million recognized on retained interests in mortgage-related securities. The favorable impact of these
items was partially offset by expected customer refunds of approximately $115 million related to cross-sell
activities in our Domestic Card business, approximately $214 million lower net gains from the sale of AFS
securities recorded in 2012 versus 2011, and a mark-to-market derivative loss of $78 million recognized in the first
quarter of 2012 related to the settlement of interest-rate swaps we entered into in 2011 to partially hedge the interest
rate risk of the net assets associated with the ING Direct acquisition.
Non-interest income of $3.5 billion in 2011 decreased by $176 million, or 5%, from non-interest income of
$3.7 billion in 2010. This decrease was attributable to: (i) the absence of a one-time pre-tax gain of $128 million
recorded in the first quarter of 2010 and net gains on the sale of securities in 2010; and (ii) the impact of contra-
revenue amounts recorded in the second and fourth quarters of 2011, including a provision of $102 million for
anticipated refunds to U.K. customers related to retrospective regulatory requirements pertaining to payment
protection insurance (“PPI”) in our U.K. business. The decrease was partially offset by increased customer fees
related to treasury management and public financing activities, and the decrease in the provision for mortgage
loan repurchases.
62