Capital One 2012 Annual Report Download - page 104
Download and view the complete annual report
Please find page 104 of the 2012 Capital One annual report below. You can navigate through the pages in the report by either clicking on the pages listed below, or by using the keyword search tool below to find specific information within the annual report.-
 1
1 -
2
-
3
-
4
-
5
-
6
-
7
-
8
-
9
-
10
-
11
-
12
-
13
-
14
-
15
-
16
-
17
-
18
-
19
-
20
-
21
-
22
-
23
-
24
-
25
-
26
-
27
-
28
-
29
-
30
-
31
-
32
-
33
-
34
-
35
-
36
-
37
-
38
-
39
-
40
-
41
-
42
-
43
-
44
-
45
-
46
-
47
-
48
-
49
-
50
-
51
-
52
-
53
-
54
-
55
-
56
-
57
-
58
-
59
-
60
-
61
-
62
-
63
-
64
-
65
-
66
-
67
-
68
-
69
-
70
-
71
-
72
-
73
-
74
-
75
-
76
-
77
-
78
-
79
-
80
-
81
-
82
-
83
-
84
-
85
-
86
-
87
-
88
-
89
-
90
-
91
-
92
-
93
-
 94
94 -
 95
95 -
 96
96 -
 97
97 -
 98
98 -
 99
99 -
 100
100 -
 101
101 -
 102
102 -
 103
103 -
 104
104 -
 105
105 -
 106
106 -
 107
107 -
 108
108 -
 109
109 -
 110
110 -
 111
111 -
 112
112 -
 113
113 -
 114
114 -
115
-
116
-
117
-
118
-
119
-
120
-
121
-
122
-
123
-
124
-
125
-
126
-
127
-
128
-
129
-
130
-
131
-
132
-
133
-
134
-
135
-
136
-
137
-
138
-
139
-
140
-
141
-
142
-
143
-
144
-
145
-
146
-
147
-
148
-
149
-
150
-
151
-
152
-
153
-
154
-
155
-
156
-
157
-
158
-
159
-
160
-
161
-
162
-
163
-
164
-
165
-
166
-
167
-
168
-
169
-
170
-
171
-
172
-
173
-
174
-
175
-
176
-
177
-
178
-
179
-
180
-
181
-
182
-
183
-
184
-
185
-
186
-
187
-
188
-
189
-
190
-
191
-
192
-
193
-
194
-
195
-
196
-
197
-
198
-
199
-
200
-
201
-
202
-
203
-
204
-
205
-
206
-
207
-
208
-
209
-
210
-
211
-
212
-
213
-
214
-
215
-
216
-
217
-
218
-
219
-
220
-
221
-
222
-
223
-
224
-
225
-
226
-
227
-
228
-
229
-
230
-
231
-
232
-
233
-
234
-
235
-
236
-
237
-
238
-
239
-
240
-
241
-
242
-
243
-
244
-
245
-
246
-
247
-
248
-
249
-
250
-
251
-
252
-
253
-
254
-
255
-
256
-
257
-
258
-
259
-
260
-
261
-
262
-
263
-
264
-
265
-
266
-
267
-
268
-
269
-
270
-
271
-
272
-
273
-
274
-
275
-
276
-
277
-
278
-
279
-
280
-
281
-
282
-
283
-
284
-
285
-
286
-
287
-
288
-
289
-
290
-
291
-
292
-
293
-
294
-
295
-
296
-
297
-
298
-
299
-
300
-
301
-
302
-
303
-
304
-
305
-
306
-
307
-
308
-
309
-
310
-
311
 |
 |

We have established representation and warranty reserves for losses associated with the mortgage loans sold by
each subsidiary that we consider to be both probable and reasonably estimable, including both litigation and non-
litigation liabilities. These reserves are reported in our consolidated balance sheets as a component of other
liabilities. The reserve setting process relies heavily on estimates, which are inherently uncertain, and requires the
application of judgment. We evaluate these estimates on a quarterly basis. We build our representation and
warranty reserves through the provision for mortgage representation and warranty losses, which we report in our
consolidated statements of income as a component of non-interest income for loans originated and sold by CCB
and Capital One Home Loans and as a component of discontinued operations for loans originated and sold by
GreenPoint. In establishing the representation and warranty reserves, we consider a variety of factors depending
on the category of purchaser.
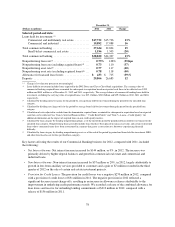
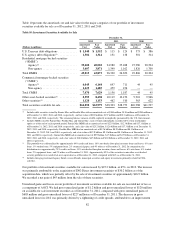
The aggregate reserves for all three subsidiaries totaled $899 million as of December 31, 2012, compared with
$919 million as of September 30, 2012, and $943 million as of December 31, 2011. The decrease in the reserve
in 2012 was driven primarily by the settlement of claims.
The table below summarizes changes in our representation and warranty reserves in 2012 and 2011.
Table 13: Changes in Representation and Warranty Reserve
Year Ended December 31,
(Dollars in millions) 2012 2011
Representation and warranty repurchase reserve, beginning of period(1) .............. $ 943 $816
Provision for mortgage representation and warranty losses(2) ...................... 349 212
Net realized losses ........................................................ (393) (85)
Representation and warranty repurchase reserve, end of period(1) ................... $ 899 $943
(1) Reported in our consolidated balance sheets as a component of other liabilities.
(2) The pre-tax portion of the provision for mortgage representation and warranty losses recognized in our consolidated statements of
income as a component of non-interest income totaled $42 million and $43 million in 2012 and 2011, respectively. The pre-tax portion of
the provision for mortgage representation and warranty losses recognized in our consolidated statements of income as a component of
discontinued operations totaled $307 million and $169 million in 2012 and 2011, respectively.
We provide additional information related to the representation and warranty reserve, including factors that may
impact the adequacy of the reserves and the ultimate amount of losses incurred by our subsidiaries, above in
“Critical Accounting Policies and Estimates—Representation and Warranty Reserve” and in “Note 21—
Commitments, Contingencies and Guarantees.”
OFF-BALANCE SHEET ARRANGEMENTS AND VARIABLE INTEREST ENTITIES
In the ordinary course of business, we are involved in various types of arrangements with limited liability
companies, partnerships or trusts that often involve special purpose entities and variable interest entities
(“VIEs”). Some of these arrangements are not recorded on our consolidated balance sheets or may be recorded in
amounts different from the full contract or notional amount of the arrangements, depending on the nature or
structure of, and accounting required to be applied to, the arrangement. These arrangements may expose us to
potential losses in excess of the amounts recorded in the consolidated balance sheets. Our involvement in these
arrangements can take many forms, including securitization and servicing activities, the purchase or sale of
mortgage-backed or other asset-backed securities in connection with our home loan portfolio and loans to VIEs
that hold debt, equity, real estate or other assets.
Our continuing involvement in unconsolidated VIEs primarily consists of interests in certain mortgage loan trusts
and community reinvestment and development entities. The carrying amount of assets and liabilities of these
85