Capital One 2012 Annual Report Download - page 232
Download and view the complete annual report
Please find page 232 of the 2012 Capital One annual report below. You can navigate through the pages in the report by either clicking on the pages listed below, or by using the keyword search tool below to find specific information within the annual report.-
 1
1 -
2
-
3
-
4
-
5
-
6
-
7
-
8
-
9
-
10
-
11
-
12
-
13
-
14
-
15
-
16
-
17
-
18
-
19
-
20
-
21
-
22
-
23
-
24
-
25
-
26
-
27
-
28
-
29
-
30
-
31
-
32
-
33
-
34
-
35
-
36
-
37
-
38
-
39
-
40
-
41
-
42
-
43
-
44
-
45
-
46
-
47
-
48
-
49
-
50
-
51
-
52
-
53
-
54
-
55
-
56
-
57
-
58
-
59
-
60
-
61
-
62
-
63
-
64
-
65
-
66
-
67
-
68
-
69
-
70
-
71
-
72
-
73
-
74
-
75
-
76
-
77
-
78
-
79
-
80
-
81
-
82
-
83
-
84
-
85
-
86
-
87
-
88
-
89
-
90
-
91
-
92
-
93
-
94
-
95
-
96
-
97
-
98
-
99
-
100
-
101
-
102
-
103
-
104
-
105
-
106
-
107
-
108
-
109
-
110
-
111
-
112
-
113
-
114
-
115
-
116
-
117
-
118
-
119
-
120
-
121
-
122
-
123
-
124
-
125
-
126
-
127
-
128
-
129
-
130
-
131
-
132
-
133
-
134
-
135
-
136
-
137
-
138
-
139
-
140
-
141
-
142
-
143
-
144
-
145
-
146
-
147
-
148
-
149
-
150
-
151
-
152
-
153
-
154
-
155
-
156
-
157
-
158
-
159
-
160
-
161
-
162
-
163
-
164
-
165
-
166
-
167
-
168
-
169
-
170
-
171
-
172
-
173
-
174
-
175
-
176
-
177
-
178
-
179
-
180
-
181
-
182
-
183
-
184
-
185
-
186
-
187
-
188
-
189
-
190
-
191
-
192
-
193
-
194
-
195
-
196
-
197
-
198
-
199
-
200
-
201
-
202
-
203
-
204
-
205
-
206
-
207
-
208
-
209
-
210
-
211
-
212
-
213
-
214
-
215
-
216
-
217
-
218
-
219
-
220
-
221
-
 222
222 -
 223
223 -
 224
224 -
 225
225 -
 226
226 -
 227
227 -
 228
228 -
 229
229 -
 230
230 -
 231
231 -
 232
232 -
 233
233 -
 234
234 -
 235
235 -
 236
236 -
 237
237 -
 238
238 -
 239
239 -
 240
240 -
 241
241 -
 242
242 -
243
-
244
-
245
-
246
-
247
-
248
-
249
-
250
-
251
-
252
-
253
-
254
-
255
-
256
-
257
-
258
-
259
-
260
-
261
-
262
-
263
-
264
-
265
-
266
-
267
-
268
-
269
-
270
-
271
-
272
-
273
-
274
-
275
-
276
-
277
-
278
-
279
-
280
-
281
-
282
-
283
-
284
-
285
-
286
-
287
-
288
-
289
-
290
-
291
-
292
-
293
-
294
-
295
-
296
-
297
-
298
-
299
-
300
-
301
-
302
-
303
-
304
-
305
-
306
-
307
-
308
-
309
-
310
-
311
 |
 |

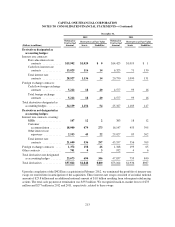
CAPITAL ONE FINANCIAL CORPORATION
NOTES TO CONSOLIDATED FINANCIAL STATEMENTS—(Continued)
December 31,
2012 2011
Notional or
Contractual
Amount
Derivatives at Fair Value Notional or
Contractual
Amount
Derivatives at Fair Value
(Dollars in millions) Assets Liabilities Assets Liabilities
Derivatives designated as
accounting hedges:
Interest rate contracts:
Fair value interest rate
contracts ............. $15,902 $1,020 $ 0 $14,425 $1,019 $ 1
Cash flow interest rate
contracts ............. 13,025 116 14 6,325 71 130
Total interest rate
contracts ............. 28,927 1,136 14 20,750 1,090 131
Foreign exchange contracts:
Cash flow foreign exchange
contracts ............. 5,212 18 40 4,577 93 16
Total foreign exchange
contracts ............. 5,212 18 40 4,577 93 16
Total derivatives designated as
accounting hedges .......... 34,139 1,154 54 25,327 1,183 147
Derivatives not designated as
accounting hedges:
Interest rate contracts covering:
MSRs ................. 147 12 2 383 18 12
Customer
accommodation ........ 18,900 479 273 16,147 453 395
Other interest rate
exposures ............ 2,553 45 22 29,027 85 362
Total interest rate
contracts ............. 21,600 536 297 45,557 556 769
Foreign exchange contracts .... 1,372 158 46 1,348 193 65
Other contracts .............. 701 0 3 932 4 6
Total derivatives not designated
as accounting hedges ....... 23,673 694 346 47,837 753 840
Total derivatives ............. $57,812 $1,848 $400 $73,164 $1,936 $987
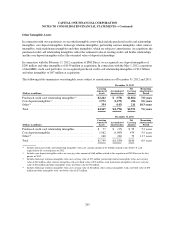
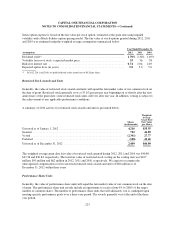
Upon the completion of the ING Direct acquisition in February 2012, we terminated the portfolio of interest-rate
swaps we entered into in anticipation of the acquisition. These interest-rate swaps consisted of an initial notional
amount of $23.8 billion and an additional notional amount of $1.0 billion resulting from subsequent rebalancing
actions. The total cash payment at termination was $355 million. We recognized mark-to-market losses of $78
million and $277 million in 2012 and 2011, respectively, related to these swaps.
213