Capital One 2012 Annual Report Download - page 199
Download and view the complete annual report
Please find page 199 of the 2012 Capital One annual report below. You can navigate through the pages in the report by either clicking on the pages listed below, or by using the keyword search tool below to find specific information within the annual report.-
 1
1 -
2
-
3
-
4
-
5
-
6
-
7
-
8
-
9
-
10
-
11
-
12
-
13
-
14
-
15
-
16
-
17
-
18
-
19
-
20
-
21
-
22
-
23
-
24
-
25
-
26
-
27
-
28
-
29
-
30
-
31
-
32
-
33
-
34
-
35
-
36
-
37
-
38
-
39
-
40
-
41
-
42
-
43
-
44
-
45
-
46
-
47
-
48
-
49
-
50
-
51
-
52
-
53
-
54
-
55
-
56
-
57
-
58
-
59
-
60
-
61
-
62
-
63
-
64
-
65
-
66
-
67
-
68
-
69
-
70
-
71
-
72
-
73
-
74
-
75
-
76
-
77
-
78
-
79
-
80
-
81
-
82
-
83
-
84
-
85
-
86
-
87
-
88
-
89
-
90
-
91
-
92
-
93
-
94
-
95
-
96
-
97
-
98
-
99
-
100
-
101
-
102
-
103
-
104
-
105
-
106
-
107
-
108
-
109
-
110
-
111
-
112
-
113
-
114
-
115
-
116
-
117
-
118
-
119
-
120
-
121
-
122
-
123
-
124
-
125
-
126
-
127
-
128
-
129
-
130
-
131
-
132
-
133
-
134
-
135
-
136
-
137
-
138
-
139
-
140
-
141
-
142
-
143
-
144
-
145
-
146
-
147
-
148
-
149
-
150
-
151
-
152
-
153
-
154
-
155
-
156
-
157
-
158
-
159
-
160
-
161
-
162
-
163
-
164
-
165
-
166
-
167
-
168
-
169
-
170
-
171
-
172
-
173
-
174
-
175
-
176
-
177
-
178
-
179
-
180
-
181
-
182
-
183
-
184
-
185
-
186
-
187
-
188
-
 189
189 -
 190
190 -
 191
191 -
 192
192 -
 193
193 -
 194
194 -
 195
195 -
 196
196 -
 197
197 -
 198
198 -
 199
199 -
 200
200 -
 201
201 -
 202
202 -
 203
203 -
 204
204 -
 205
205 -
 206
206 -
 207
207 -
 208
208 -
 209
209 -
210
-
211
-
212
-
213
-
214
-
215
-
216
-
217
-
218
-
219
-
220
-
221
-
222
-
223
-
224
-
225
-
226
-
227
-
228
-
229
-
230
-
231
-
232
-
233
-
234
-
235
-
236
-
237
-
238
-
239
-
240
-
241
-
242
-
243
-
244
-
245
-
246
-
247
-
248
-
249
-
250
-
251
-
252
-
253
-
254
-
255
-
256
-
257
-
258
-
259
-
260
-
261
-
262
-
263
-
264
-
265
-
266
-
267
-
268
-
269
-
270
-
271
-
272
-
273
-
274
-
275
-
276
-
277
-
278
-
279
-
280
-
281
-
282
-
283
-
284
-
285
-
286
-
287
-
288
-
289
-
290
-
291
-
292
-
293
-
294
-
295
-
296
-
297
-
298
-
299
-
300
-
301
-
302
-
303
-
304
-
305
-
306
-
307
-
308
-
309
-
310
-
311
 |
 |

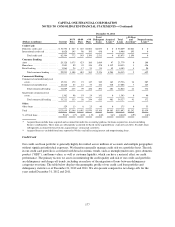
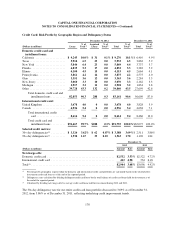
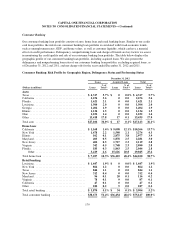
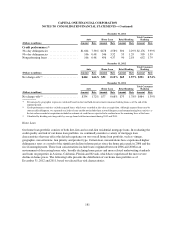
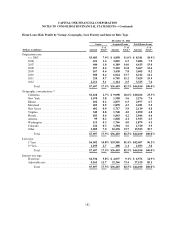
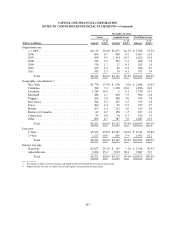
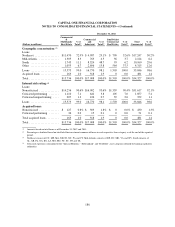
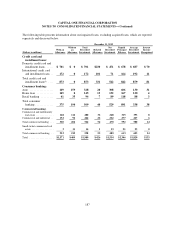
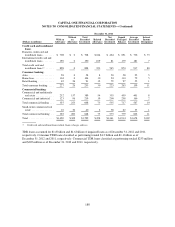
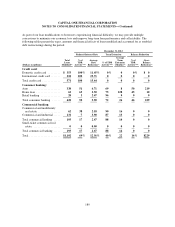
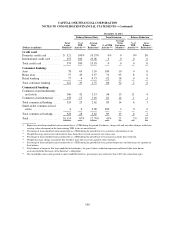
CAPITAL ONE FINANCIAL CORPORATION
NOTES TO CONSOLIDATED FINANCIAL STATEMENTS—(Continued)
December 31, 2012
Auto Home Loan Retail Banking
Total Consumer
Banking
(Dollars in millions) Amount Rate Amount Rate Amount Rate Amount Rate
Credit performance:(2)
30+ day delinquencies .................... $2,049 7.55% $380 0.86% $81 2.07%$2,510 3.34%
90+ day delinquencies .................... 149 0.55 288 0.65 45 1.15 482 0.64
Nonperforming loans ..................... 149 0.55 422 0.96 71 1.82 642 0.85
December 31, 2011
Loans Acquired Loans Total
(Dollars in millions) Loans
% of
Total(1) Loans
% of
Total(1) Loans
% of
Total(1)
Auto:
Texas ........................................ $ 3,901 10.7% $ 0 0.0% $ 3,901 10.7%
California .................................... 1,837 5.1 0 0.0 1,837 5.1
Louisiana ..................................... 1,389 3.8 0 0.0 1,389 3.8
Florida ....................................... 1,196 3.3 0 0.0 1,196 3.3
Georgia ...................................... 1,124 3.1 0 0.0 1,124 3.1
Illinois ....................................... 950 2.6 0 0.0 950 2.6
New York .................................... 940 2.6 0 0.0 940 2.6
Other ........................................ 10,395 28.7 47 0.1 10,442 28.8
Total auto .................................... $21,732 59.9% $ 47 0.1% $21,779 60.0%
Home loan:
New York .................................... $ 1,770 4.9% $ 276 0.8% $ 2,046 5.7%
California .................................... 768 2.1 1,128 3.1 1,896 5.2
Louisiana ..................................... 1,528 4.2 2 0.0 1,530 4.2
Maryland ..................................... 286 0.8 618 1.7 904 2.5
Virginia ...................................... 206 0.6 588 1.6 794 2.2
New Jersey ................................... 344 0.9 235 0.6 579 1.5
Other ........................................ 1,419 3.9 1,265 3.5 2,684 7.4
Total home loan ............................... $ 6,321 17.4% $4,112 11.3% $10,433 28.7%
Retail banking:
Louisiana ..................................... $ 1,514 4.2% $ 0 0.0% $ 1,514 4.2%
Texas ........................................ 930 2.6 0 0.0 930 2.6
New York .................................... 896 2.5 0 0.0 896 2.5
New Jersey ................................... 295 0.8 0 0.0 295 0.8
District of Columbia ............................ 254 0.7 7 0.0 261 0.7
Maryland ..................................... 49 0.1 23 0.1 72 0.2
Virginia ...................................... 30 0.1 12 0.0 42 0.1
Other ........................................ 90 0.2 3 0.0 93 0.2
Total retail banking ............................. $ 4,058 11.2% $ 45 0.1% $ 4,103 11.3%
Total consumer banking ......................... $32,111 88.5% $4,204 11.5% $36,315 100.0%
180