Capital One 2012 Annual Report Download - page 130
Download and view the complete annual report
Please find page 130 of the 2012 Capital One annual report below. You can navigate through the pages in the report by either clicking on the pages listed below, or by using the keyword search tool below to find specific information within the annual report.-
 1
1 -
2
-
3
-
4
-
5
-
6
-
7
-
8
-
9
-
10
-
11
-
12
-
13
-
14
-
15
-
16
-
17
-
18
-
19
-
20
-
21
-
22
-
23
-
24
-
25
-
26
-
27
-
28
-
29
-
30
-
31
-
32
-
33
-
34
-
35
-
36
-
37
-
38
-
39
-
40
-
41
-
42
-
43
-
44
-
45
-
46
-
47
-
48
-
49
-
50
-
51
-
52
-
53
-
54
-
55
-
56
-
57
-
58
-
59
-
60
-
61
-
62
-
63
-
64
-
65
-
66
-
67
-
68
-
69
-
70
-
71
-
72
-
73
-
74
-
75
-
76
-
77
-
78
-
79
-
80
-
81
-
82
-
83
-
84
-
85
-
86
-
87
-
88
-
89
-
90
-
91
-
92
-
93
-
94
-
95
-
96
-
97
-
98
-
99
-
100
-
101
-
102
-
103
-
104
-
105
-
106
-
107
-
108
-
109
-
110
-
111
-
112
-
113
-
114
-
115
-
116
-
117
-
118
-
119
-
 120
120 -
 121
121 -
 122
122 -
 123
123 -
 124
124 -
 125
125 -
 126
126 -
 127
127 -
 128
128 -
 129
129 -
 130
130 -
 131
131 -
 132
132 -
 133
133 -
 134
134 -
 135
135 -
 136
136 -
 137
137 -
 138
138 -
 139
139 -
 140
140 -
141
-
142
-
143
-
144
-
145
-
146
-
147
-
148
-
149
-
150
-
151
-
152
-
153
-
154
-
155
-
156
-
157
-
158
-
159
-
160
-
161
-
162
-
163
-
164
-
165
-
166
-
167
-
168
-
169
-
170
-
171
-
172
-
173
-
174
-
175
-
176
-
177
-
178
-
179
-
180
-
181
-
182
-
183
-
184
-
185
-
186
-
187
-
188
-
189
-
190
-
191
-
192
-
193
-
194
-
195
-
196
-
197
-
198
-
199
-
200
-
201
-
202
-
203
-
204
-
205
-
206
-
207
-
208
-
209
-
210
-
211
-
212
-
213
-
214
-
215
-
216
-
217
-
218
-
219
-
220
-
221
-
222
-
223
-
224
-
225
-
226
-
227
-
228
-
229
-
230
-
231
-
232
-
233
-
234
-
235
-
236
-
237
-
238
-
239
-
240
-
241
-
242
-
243
-
244
-
245
-
246
-
247
-
248
-
249
-
250
-
251
-
252
-
253
-
254
-
255
-
256
-
257
-
258
-
259
-
260
-
261
-
262
-
263
-
264
-
265
-
266
-
267
-
268
-
269
-
270
-
271
-
272
-
273
-
274
-
275
-
276
-
277
-
278
-
279
-
280
-
281
-
282
-
283
-
284
-
285
-
286
-
287
-
288
-
289
-
290
-
291
-
292
-
293
-
294
-
295
-
296
-
297
-
298
-
299
-
300
-
301
-
302
-
303
-
304
-
305
-
306
-
307
-
308
-
309
-
310
-
311
 |
 |

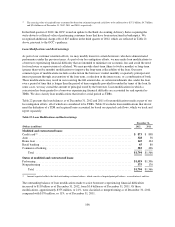
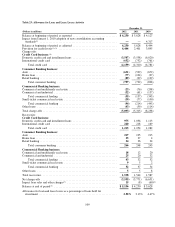
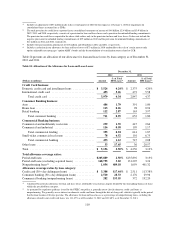
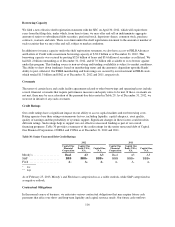
We increased our allowance by $906 million in 2012 to $5.2 billion as of December 31, 2012. The increase was
primarily driven by the establishment of an initial allowance of $1.2 billion related to the addition of the
$26.2 billion in outstanding receivables acquired in the 2012 U.S. card acquisition that had existing revolving
privileges at acquisition. The allowance for these loans was calculated using the same methodology utilized for
determining the allowance for our existing credit card loan portfolio.
On October 29, 2012, Hurricane Sandy made landfall on the New Jersey coast, resulting in severe disaster in
coastal counties in Connecticut, New Jersey and New York and varying degrees of damage and disruption in
other Northeast and Mid-Atlantic states. Because we have significant consumer and commercial loan exposure in
Connecticut, New Jersey and New York, the storm and its aftermath resulted in an elevated risk of loss for us
within this region. Based on our assessment of the impact of Hurricane Sandy on our loan portfolio, we recorded
an allowance of $39 million as of December 31, 2012, which is included in our allowance for loan and lease
losses of $5.2 billion as of December 31, 2012.
Although the allowance increased in 2012, the coverage ratio of the allowance to total loans held for investment
fell by 63 basis points to 2.50% as of December 31, 2012, from 3.13% as of December 31, 2011. The decrease in
the allowance coverage ratio was largely due to the addition of loans acquired in the ING Direct and 2012 U.S.
card acquisitions accounted for based on estimated cash flows expected to be collected. As discussed above in
“Item 6. Selected Financial Data,” because the accounting for these loans takes into consideration future credit
losses expected to be incurred, there are no charge-offs or an allowance associated with these loans unless the
estimated cash flows expected to be collected decrease subsequent to acquisition.
We describe our methodology for determining our allowance for loan and lease losses, by loan category, in “Note
1—Summary of Significant Accounting Policies—Allowance for Loan and Lease Losses.” Also, see “Critical
Accounting Policies and Estimates—Allowance for Loan and Lease Losses” and “Note 6—Allowance for Loan
and Lease Losses” for additional information.
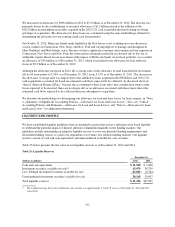
LIQUIDITY RISK PROFILE
We have established liquidity guidelines that are intended to ensure that we have sufficient asset-based liquidity
to withstand the potential impact of deposit attrition or diminished liquidity in the funding markets. Our
guidelines include maintaining an adequate liquidity reserve to cover our potential funding requirements and
diversified funding sources to avoid over-dependence on volatile, less reliable funding markets. Our liquidity
reserves consist of cash and cash equivalents and unencumbered available-for-sale securities.
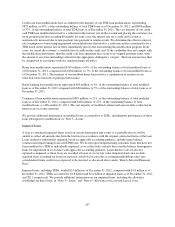
Table 25 below presents the fair value of our liquidity reserves as of December 31, 2012 and 2011.
Table 25: Liquidity Reserves
December 31,
(Dollars in millions) 2012 2011
Cash and cash equivalents .................................................... $ 11,058 $ 5,838
Investment securities available for sale(1) ........................................ 63,979 38,759
Less: Pledged investment securities available for sale .............................. (13,811) (8,762)
Unencumbered investment securities available for sale ............................. 50,168 29,997
Total liquidity reserves ...................................................... $ 61,226 $35,835
(1) The weighted average life of our available-for-sale securities was approximately 4.3 and 2.9 years as of December 31, 2012 and 2011,
respectively.
111