Capital One 2012 Annual Report Download - page 103
Download and view the complete annual report
Please find page 103 of the 2012 Capital One annual report below. You can navigate through the pages in the report by either clicking on the pages listed below, or by using the keyword search tool below to find specific information within the annual report.-
 1
1 -
2
-
3
-
4
-
5
-
6
-
7
-
8
-
9
-
10
-
11
-
12
-
13
-
14
-
15
-
16
-
17
-
18
-
19
-
20
-
21
-
22
-
23
-
24
-
25
-
26
-
27
-
28
-
29
-
30
-
31
-
32
-
33
-
34
-
35
-
36
-
37
-
38
-
39
-
40
-
41
-
42
-
43
-
44
-
45
-
46
-
47
-
48
-
49
-
50
-
51
-
52
-
53
-
54
-
55
-
56
-
57
-
58
-
59
-
60
-
61
-
62
-
63
-
64
-
65
-
66
-
67
-
68
-
69
-
70
-
71
-
72
-
73
-
74
-
75
-
76
-
77
-
78
-
79
-
80
-
81
-
82
-
83
-
84
-
85
-
86
-
87
-
88
-
89
-
90
-
91
-
92
-
 93
93 -
 94
94 -
 95
95 -
 96
96 -
 97
97 -
 98
98 -
 99
99 -
 100
100 -
 101
101 -
 102
102 -
 103
103 -
 104
104 -
 105
105 -
 106
106 -
 107
107 -
 108
108 -
 109
109 -
 110
110 -
 111
111 -
 112
112 -
 113
113 -
114
-
115
-
116
-
117
-
118
-
119
-
120
-
121
-
122
-
123
-
124
-
125
-
126
-
127
-
128
-
129
-
130
-
131
-
132
-
133
-
134
-
135
-
136
-
137
-
138
-
139
-
140
-
141
-
142
-
143
-
144
-
145
-
146
-
147
-
148
-
149
-
150
-
151
-
152
-
153
-
154
-
155
-
156
-
157
-
158
-
159
-
160
-
161
-
162
-
163
-
164
-
165
-
166
-
167
-
168
-
169
-
170
-
171
-
172
-
173
-
174
-
175
-
176
-
177
-
178
-
179
-
180
-
181
-
182
-
183
-
184
-
185
-
186
-
187
-
188
-
189
-
190
-
191
-
192
-
193
-
194
-
195
-
196
-
197
-
198
-
199
-
200
-
201
-
202
-
203
-
204
-
205
-
206
-
207
-
208
-
209
-
210
-
211
-
212
-
213
-
214
-
215
-
216
-
217
-
218
-
219
-
220
-
221
-
222
-
223
-
224
-
225
-
226
-
227
-
228
-
229
-
230
-
231
-
232
-
233
-
234
-
235
-
236
-
237
-
238
-
239
-
240
-
241
-
242
-
243
-
244
-
245
-
246
-
247
-
248
-
249
-
250
-
251
-
252
-
253
-
254
-
255
-
256
-
257
-
258
-
259
-
260
-
261
-
262
-
263
-
264
-
265
-
266
-
267
-
268
-
269
-
270
-
271
-
272
-
273
-
274
-
275
-
276
-
277
-
278
-
279
-
280
-
281
-
282
-
283
-
284
-
285
-
286
-
287
-
288
-
289
-
290
-
291
-
292
-
293
-
294
-
295
-
296
-
297
-
298
-
299
-
300
-
301
-
302
-
303
-
304
-
305
-
306
-
307
-
308
-
309
-
310
-
311
 |
 |
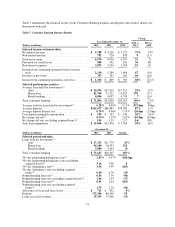
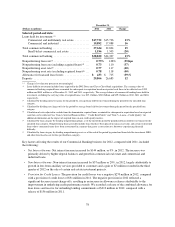
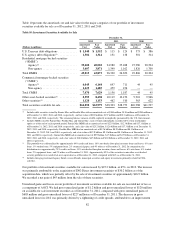
Period-end loans held for investment increased by $70.0 billion, or 52%, in 2012 to $205.9 billion as of
December 31, 2012. The increase was primarily attributable to the addition of the acquired ING Direct loan
portfolio of $40.4 billion and receivables acquired in the 2012 U.S. card acquisition of $27.8 billion, each
designated as held for investment. Excluding the impact of these loans, period-end loans held for investment
increased by $1.8 billion, or 1%. This increase reflected commercial loan growth and continued growth in auto
loans, which was partially offset by the continued expected run-off of loans in businesses we exited or
repositioned, other loan pay downs and charge-offs. The run-off portfolios include installment loans in our Credit
Card business, home loans in our Consumer Banking business and small-ticket commercial real estate loans in
our Commercial Banking business. The run-off of home loans has accelerated slightly as a result of the low
mortgage interest rate environment. We provide additional information on the composition of our loan portfolio
and credit quality below in “Credit Risk Profile” and in “Note 5—Loans.”
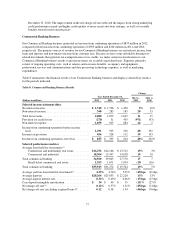
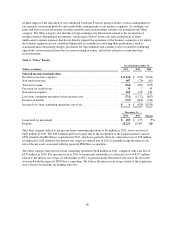
Customer Deposits
Our customer deposits have become our largest source of funding for our operations and asset growth, providing
a sizeable and consistent source of low-cost funds. Total customer deposits increased by $84.3 billion, or 66%, in
2012, to $212.5 billion as of December 31, 2012, from $128.2 billion as of December 31, 2011. The increase in
deposits reflects the addition of $84.4 billion in deposits from the ING Direct acquisition and increased retail
marketing efforts to attract new business and our continued strategy to leverage our bank outlets to attract lower
cost deposit funding. We provide information on the composition of our deposits, average outstanding balances,
interest expense and yield below in “Liquidity Risk Profile.”
Securitized Debt Obligations
Borrowings owed to securitization investors decreased by $5.1 billion to $11.4 billion as of December 31, 2012,
from $16.5 billion as of December 31, 2011. The decrease was attributable to the scheduled maturities of the debt
within our credit card securitization trusts.
Other Debt
Other debt includes federal funds purchased and securities loaned or sold under agreements to repurchase, senior
and subordinated notes and other borrowings, including junior subordinated debt and Federal Home Loan Bank
(“FHLB”) advances. Other debt totaled $38.5 billion as of December 31, 2012, of which $21.1 billion
represented short-term borrowings and $17.4 billion represented long-term borrowings. Other debt totaled
$23.0 billion as of December 31, 2011, of which $7.3 billion represented short-term borrowings and $15.7 billion
represented long-term borrowings.
The increase in other debt of $15.5 billion in 2012 was primarily attributable to an increase in FHLB advances of
$14.0 billion increase, the majority of which occurred in the fourth quarter of 2012, to meet seasonal loan
growth, fund an increase in our investment securities and cover the withdrawal of a portion of the holding
company’s deposits at our banking subsidiaries in anticipation of the January 2, 2013 redemption of the $3.65
billion of trust preferred securities. We provide additional information on our borrowings in “Note 10—Deposits
and Borrowings.”
Potential Mortgage Representation & Warranty Liabilities
In recent years, we acquired three subsidiaries that originated residential mortgage loans and sold them to various
purchasers, including purchasers who created securitization trusts. These subsidiaries are Capital One Home
Loans, which was acquired in February 2005; GreenPoint Mortgage Funding, Inc. (“GreenPoint”), which was
acquired in December 2006 as part of the North Fork acquisition; and Chevy Chase Bank, which was acquired in
February 2009 and subsequently merged into CONA.
84