Capital One 2012 Annual Report Download - page 266
Download and view the complete annual report
Please find page 266 of the 2012 Capital One annual report below. You can navigate through the pages in the report by either clicking on the pages listed below, or by using the keyword search tool below to find specific information within the annual report.-
 1
1 -
2
-
3
-
4
-
5
-
6
-
7
-
8
-
9
-
10
-
11
-
12
-
13
-
14
-
15
-
16
-
17
-
18
-
19
-
20
-
21
-
22
-
23
-
24
-
25
-
26
-
27
-
28
-
29
-
30
-
31
-
32
-
33
-
34
-
35
-
36
-
37
-
38
-
39
-
40
-
41
-
42
-
43
-
44
-
45
-
46
-
47
-
48
-
49
-
50
-
51
-
52
-
53
-
54
-
55
-
56
-
57
-
58
-
59
-
60
-
61
-
62
-
63
-
64
-
65
-
66
-
67
-
68
-
69
-
70
-
71
-
72
-
73
-
74
-
75
-
76
-
77
-
78
-
79
-
80
-
81
-
82
-
83
-
84
-
85
-
86
-
87
-
88
-
89
-
90
-
91
-
92
-
93
-
94
-
95
-
96
-
97
-
98
-
99
-
100
-
101
-
102
-
103
-
104
-
105
-
106
-
107
-
108
-
109
-
110
-
111
-
112
-
113
-
114
-
115
-
116
-
117
-
118
-
119
-
120
-
121
-
122
-
123
-
124
-
125
-
126
-
127
-
128
-
129
-
130
-
131
-
132
-
133
-
134
-
135
-
136
-
137
-
138
-
139
-
140
-
141
-
142
-
143
-
144
-
145
-
146
-
147
-
148
-
149
-
150
-
151
-
152
-
153
-
154
-
155
-
156
-
157
-
158
-
159
-
160
-
161
-
162
-
163
-
164
-
165
-
166
-
167
-
168
-
169
-
170
-
171
-
172
-
173
-
174
-
175
-
176
-
177
-
178
-
179
-
180
-
181
-
182
-
183
-
184
-
185
-
186
-
187
-
188
-
189
-
190
-
191
-
192
-
193
-
194
-
195
-
196
-
197
-
198
-
199
-
200
-
201
-
202
-
203
-
204
-
205
-
206
-
207
-
208
-
209
-
210
-
211
-
212
-
213
-
214
-
215
-
216
-
217
-
218
-
219
-
220
-
221
-
222
-
223
-
224
-
225
-
226
-
227
-
228
-
229
-
230
-
231
-
232
-
233
-
234
-
235
-
236
-
237
-
238
-
239
-
240
-
241
-
242
-
243
-
244
-
245
-
246
-
247
-
248
-
249
-
250
-
251
-
252
-
253
-
254
-
255
-
 256
256 -
 257
257 -
 258
258 -
 259
259 -
 260
260 -
 261
261 -
 262
262 -
 263
263 -
 264
264 -
 265
265 -
 266
266 -
 267
267 -
 268
268 -
 269
269 -
 270
270 -
 271
271 -
 272
272 -
 273
273 -
 274
274 -
 275
275 -
 276
276 -
277
-
278
-
279
-
280
-
281
-
282
-
283
-
284
-
285
-
286
-
287
-
288
-
289
-
290
-
291
-
292
-
293
-
294
-
295
-
296
-
297
-
298
-
299
-
300
-
301
-
302
-
303
-
304
-
305
-
306
-
307
-
308
-
309
-
310
-
311
 |
 |
CAPITAL ONE FINANCIAL CORPORATION
NOTES TO CONSOLIDATED FINANCIAL STATEMENTS—(Continued)
The impact of counterparty non-performance risk is considered when measuring the fair value of derivative
receivables. These derivatives are included in other assets on the balance sheet.
We validate the pricing obtained from the internal models through comparison of pricing to additional sources,
including external valuation agents and other internal sources. Pricing variances among different pricing sources
are analyzed and validated.
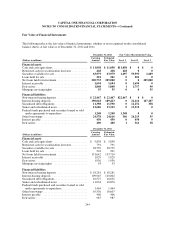
Mortgage Servicing Rights
Mortgage Servicing Rights (“MSRs”) do not trade in an active market with readily observable prices.
Accordingly, we determine the fair value of MSRs using a valuation model that calculates the present value of
estimated future net servicing income. The model incorporates assumptions that market participants use in
estimating future net servicing income, including estimates of prepayment spreads, discount rate, cost to service,
contractual servicing fee income, ancillary income and late fees. We record MSRs at fair value on a recurring
basis. Fair value measurements of MSRs use significant unobservable inputs and, accordingly, are classified
as Level 3.
Financial Liabilities
Non-Interest Bearing Deposits
The carrying amount of non-interest bearing deposits approximates fair value.
Interest-Bearing Deposits
The fair value of interest-bearing deposits was determined based on discounted expected cash flows using
discount rates consistent with current market rates for similar products with similar remaining terms.
Securitized Debt Obligations
We utilized multiple third party pricing services to obtain fair value measures for the large majority of our
securitized debt obligations. The techniques used by the pricing services utilize observable market data to the extent
available; and pricing models may be used which incorporate available trade, bid and other market information as
described in the above section. We used internal pricing models, discounted cash flow models or similar techniques
to estimate the fair value of certain securitization trusts where third-party pricing was not available.
Senior and Subordinated Notes
We engage multiple third party pricing services in order to estimate the fair value of senior and subordinated
notes. The pricing service utilizes a pricing model that incorporates available trade, bid and other market
information. It also incorporates spread assumptions, volatility assumptions and relevant credit information into
the pricing models.
Federal Funds Purchased and Securities Loaned or Sold under Agreements to Repurchase and Other
Borrowings
The carrying amount of federal funds purchased and repurchase agreements approximates fair value. The fair
value of FHLB advances was determined based on discounted expected cash flows using discount rates
247