Capital One 2012 Annual Report Download - page 223
Download and view the complete annual report
Please find page 223 of the 2012 Capital One annual report below. You can navigate through the pages in the report by either clicking on the pages listed below, or by using the keyword search tool below to find specific information within the annual report.-
 1
1 -
2
-
3
-
4
-
5
-
6
-
7
-
8
-
9
-
10
-
11
-
12
-
13
-
14
-
15
-
16
-
17
-
18
-
19
-
20
-
21
-
22
-
23
-
24
-
25
-
26
-
27
-
28
-
29
-
30
-
31
-
32
-
33
-
34
-
35
-
36
-
37
-
38
-
39
-
40
-
41
-
42
-
43
-
44
-
45
-
46
-
47
-
48
-
49
-
50
-
51
-
52
-
53
-
54
-
55
-
56
-
57
-
58
-
59
-
60
-
61
-
62
-
63
-
64
-
65
-
66
-
67
-
68
-
69
-
70
-
71
-
72
-
73
-
74
-
75
-
76
-
77
-
78
-
79
-
80
-
81
-
82
-
83
-
84
-
85
-
86
-
87
-
88
-
89
-
90
-
91
-
92
-
93
-
94
-
95
-
96
-
97
-
98
-
99
-
100
-
101
-
102
-
103
-
104
-
105
-
106
-
107
-
108
-
109
-
110
-
111
-
112
-
113
-
114
-
115
-
116
-
117
-
118
-
119
-
120
-
121
-
122
-
123
-
124
-
125
-
126
-
127
-
128
-
129
-
130
-
131
-
132
-
133
-
134
-
135
-
136
-
137
-
138
-
139
-
140
-
141
-
142
-
143
-
144
-
145
-
146
-
147
-
148
-
149
-
150
-
151
-
152
-
153
-
154
-
155
-
156
-
157
-
158
-
159
-
160
-
161
-
162
-
163
-
164
-
165
-
166
-
167
-
168
-
169
-
170
-
171
-
172
-
173
-
174
-
175
-
176
-
177
-
178
-
179
-
180
-
181
-
182
-
183
-
184
-
185
-
186
-
187
-
188
-
189
-
190
-
191
-
192
-
193
-
194
-
195
-
196
-
197
-
198
-
199
-
200
-
201
-
202
-
203
-
204
-
205
-
206
-
207
-
208
-
209
-
210
-
211
-
212
-
 213
213 -
 214
214 -
 215
215 -
 216
216 -
 217
217 -
 218
218 -
 219
219 -
 220
220 -
 221
221 -
 222
222 -
 223
223 -
 224
224 -
 225
225 -
 226
226 -
 227
227 -
 228
228 -
 229
229 -
 230
230 -
 231
231 -
 232
232 -
 233
233 -
234
-
235
-
236
-
237
-
238
-
239
-
240
-
241
-
242
-
243
-
244
-
245
-
246
-
247
-
248
-
249
-
250
-
251
-
252
-
253
-
254
-
255
-
256
-
257
-
258
-
259
-
260
-
261
-
262
-
263
-
264
-
265
-
266
-
267
-
268
-
269
-
270
-
271
-
272
-
273
-
274
-
275
-
276
-
277
-
278
-
279
-
280
-
281
-
282
-
283
-
284
-
285
-
286
-
287
-
288
-
289
-
290
-
291
-
292
-
293
-
294
-
295
-
296
-
297
-
298
-
299
-
300
-
301
-
302
-
303
-
304
-
305
-
306
-
307
-
308
-
309
-
310
-
311
 |
 |

CAPITAL ONE FINANCIAL CORPORATION
NOTES TO CONSOLIDATED FINANCIAL STATEMENTS—(Continued)
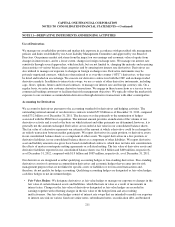
external cost of equity with adjustments for risk inherent in each reporting unit. Discount rates used for the
reporting units ranged from 9.0% to 12.8%. The key inputs into the discounted cash flow analysis were
corroborated with market data, where available, indicating that assumptions used were within a reasonable range
of observable market data.
Based on the comparison of fair value to carrying amount, as calculated using the methodology summarized
above, fair value exceeded the carrying amount for all reporting units as of our annual testing date. Therefore, the
goodwill of our reporting units was considered not impaired, and the second step of impairment testing was
unnecessary.
As part of the annual goodwill impairment test, we assessed our market capitalization based on the average
market price relative to the aggregate fair value of our reporting units and determined that any excess fair value
in our reporting units at that time could be attributed to a reasonable control premium compared to historical
control premiums seen in the industry.
We calculate the carrying values of our reporting units using an economic capital approach based on each
reporting unit’s specific capital requirements and risks. Total reporting unit carrying values for the October 1,
2012 annual goodwill impairment test were $31.5 billion, compared to total Company equity of $39.7 billion as
of September 30, 2012 as reported in our third quarter 2012 Form 10-Q filed with the SEC. The $8.2 billion
remaining equity is primarily attributable to the following items: capital allocated to our Other operations, which
are discussed in “Note 20–Business Segments;” preferred stock and unrealized gains in AOCI related to
available-for-sale securities; and capital that is reserved for building up to future capital requirements related to
our reporting units and our Other operations. The remaining equity, which represented approximately 3% of our
total equity, is reserved for future capital needs such as balance sheet growth, acquisitions, dividends and share
repurchases and one-time events subject to regulatory approvals. The capital reserved for our reporting units’
future capital requirements is not included in our reporting unit carrying values for our 2012 annual goodwill
impairment test, since it does not represent capital allocated to and used in our reporting units’ businesses as of
October 1, 2012; however, if the reserved capital was allocated to our reporting units’ carrying values for our
2012 annual goodwill impairment test, the reporting units’ fair values would continue to exceed their carrying
values, resulting in no goodwill impairment.
We will continue to regularly monitor our market capitalization and capital allocations in 2013, overall economic
conditions and other events or circumstances that may result in an impairment of goodwill in the future.
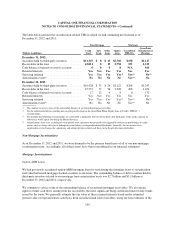
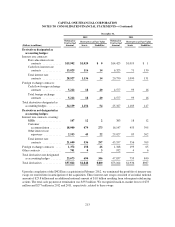
The following table provides a summary of goodwill based upon our business segments as of December 31, 2012
and 2011:
(Dollars in millions) Credit Card Consumer Commercial Total
Total Company
Balance as of December 31, 2010 ......................... $4,690 $4,583 $4,318 $13,591
Acquisitions .......................................... 3 0 0 3
Other adjustments ...................................... (2) 0 0 (2)
Balance as of December 31, 2011 ......................... $4,691 $4,583 $4,318 $13,592
Acquisitions .......................................... 304 0 0 304
Other adjustments ...................................... 8008
Balance as of December 31, 2012 ......................... $5,003 $4,583 $4,318 $13,904
204