Capital One 2012 Annual Report Download - page 184
Download and view the complete annual report
Please find page 184 of the 2012 Capital One annual report below. You can navigate through the pages in the report by either clicking on the pages listed below, or by using the keyword search tool below to find specific information within the annual report.-
 1
1 -
2
-
3
-
4
-
5
-
6
-
7
-
8
-
9
-
10
-
11
-
12
-
13
-
14
-
15
-
16
-
17
-
18
-
19
-
20
-
21
-
22
-
23
-
24
-
25
-
26
-
27
-
28
-
29
-
30
-
31
-
32
-
33
-
34
-
35
-
36
-
37
-
38
-
39
-
40
-
41
-
42
-
43
-
44
-
45
-
46
-
47
-
48
-
49
-
50
-
51
-
52
-
53
-
54
-
55
-
56
-
57
-
58
-
59
-
60
-
61
-
62
-
63
-
64
-
65
-
66
-
67
-
68
-
69
-
70
-
71
-
72
-
73
-
74
-
75
-
76
-
77
-
78
-
79
-
80
-
81
-
82
-
83
-
84
-
85
-
86
-
87
-
88
-
89
-
90
-
91
-
92
-
93
-
94
-
95
-
96
-
97
-
98
-
99
-
100
-
101
-
102
-
103
-
104
-
105
-
106
-
107
-
108
-
109
-
110
-
111
-
112
-
113
-
114
-
115
-
116
-
117
-
118
-
119
-
120
-
121
-
122
-
123
-
124
-
125
-
126
-
127
-
128
-
129
-
130
-
131
-
132
-
133
-
134
-
135
-
136
-
137
-
138
-
139
-
140
-
141
-
142
-
143
-
144
-
145
-
146
-
147
-
148
-
149
-
150
-
151
-
152
-
153
-
154
-
155
-
156
-
157
-
158
-
159
-
160
-
161
-
162
-
163
-
164
-
165
-
166
-
167
-
168
-
169
-
170
-
171
-
172
-
173
-
 174
174 -
 175
175 -
 176
176 -
 177
177 -
 178
178 -
 179
179 -
 180
180 -
 181
181 -
 182
182 -
 183
183 -
 184
184 -
 185
185 -
 186
186 -
 187
187 -
 188
188 -
 189
189 -
 190
190 -
 191
191 -
 192
192 -
 193
193 -
 194
194 -
195
-
196
-
197
-
198
-
199
-
200
-
201
-
202
-
203
-
204
-
205
-
206
-
207
-
208
-
209
-
210
-
211
-
212
-
213
-
214
-
215
-
216
-
217
-
218
-
219
-
220
-
221
-
222
-
223
-
224
-
225
-
226
-
227
-
228
-
229
-
230
-
231
-
232
-
233
-
234
-
235
-
236
-
237
-
238
-
239
-
240
-
241
-
242
-
243
-
244
-
245
-
246
-
247
-
248
-
249
-
250
-
251
-
252
-
253
-
254
-
255
-
256
-
257
-
258
-
259
-
260
-
261
-
262
-
263
-
264
-
265
-
266
-
267
-
268
-
269
-
270
-
271
-
272
-
273
-
274
-
275
-
276
-
277
-
278
-
279
-
280
-
281
-
282
-
283
-
284
-
285
-
286
-
287
-
288
-
289
-
290
-
291
-
292
-
293
-
294
-
295
-
296
-
297
-
298
-
299
-
300
-
301
-
302
-
303
-
304
-
305
-
306
-
307
-
308
-
309
-
310
-
311
 |
 |

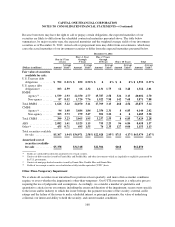
CAPITAL ONE FINANCIAL CORPORATION
NOTES TO CONSOLIDATED FINANCIAL STATEMENTS—(Continued)
December 31, 2012
(Dollars in millions)
Amortized
Cost
Total
Gross
Unrealized
Gains
Gross
Unrealized
Losses-
OTTI(1)
Gross
Unrealized
Losses-
Other(2)
Total
Gross
Unrealized
Losses
Fair
Value
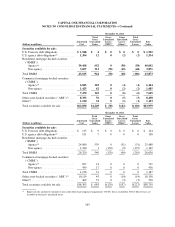
Securities available for sale:
U.S. Treasury debt obligations ........... $ 1,548 $ 4 $ 0 $ 0 $ 0 $ 1,552
U.S. agency debt obligations(3) ........... 1,304 12 0 (2) (2) 1,314
Residential mortgage-backed securities
(“RMBS”):
Agency(4) ........................ 39,408 652 0 (58) (58) 40,002
Non-agency ...................... 3,607 312 (38) (10) (48) 3,871
Total RMBS .......................... 43,015 964 (38) (68) (106) 43,873
Commercial mortgage-backed securities
(“CMBS”):
Agency(4) ........................ 6,045 103 0 (4) (4) 6,144
Non-agency ...................... 1,425 62 0 (2) (2) 1,485
Total CMBS .......................... 7,470 165 0 (6) (6) 7,629
Other asset-backed securities (“ABS”)(5) ... 8,393 70 0 (5) (5) 8,458
Other(6) .............................. 1,120 34 0 (1) (1) 1,153
Total securities available for sale ......... $62,850 $1,249 $ (38) $(82) $(120) $63,979
December 31, 2011
(Dollars in millions)
Amortized
Cost
Total
Gross
Unrealized
Gains
Gross
Unrealized
Losses-
OTTI(1)
Gross
Unrealized
Losses-
Other(2)
Total
Gross
Unrealized
Losses
Fair
Value
Securities available for sale:
U.S. Treasury debt obligations ........... $ 115 $ 9 $ 0 $ 0 $ 0 $ 124
U.S. agency debt obligations(3) ........... 131 7 0 0 0 138
Residential mortgage-backed securities
(“RMBS”):
Agency(4) ........................ 24,980 539 0 (31) (31) 25,488
Non-agency ...................... 1,340 1 (170) (9) (179) 1,162
Total RMBS .......................... 26,320 540 (170) (40) (210) 26,650
Commercial mortgage-backed securities
(“CMBS”):
Agency(4) ........................ 697 14 0 0 0 711
Non-agency ...................... 459 17 0 0 0 476
Total CMBS .......................... 1,156 31 0 0 0 1,187
Other asset-backed securities (“ABS”)(5) . . . 10,119 45 0 (14) (14) 10,150
Other(6) .............................. 462 51 0 (3) (3) 510
Total securities available for sale ......... $38,303 $ 683 $(170) $(57) $(227) $38,759
(1) Represents the amount of cumulative non-credit other-than-temporary impairment (“OTTI”) losses recorded in AOCI. These losses are
included in total gross unrealized losses.
165