Capital One 2012 Annual Report Download - page 83
Download and view the complete annual report
Please find page 83 of the 2012 Capital One annual report below. You can navigate through the pages in the report by either clicking on the pages listed below, or by using the keyword search tool below to find specific information within the annual report.-
 1
1 -
2
-
3
-
4
-
5
-
6
-
7
-
8
-
9
-
10
-
11
-
12
-
13
-
14
-
15
-
16
-
17
-
18
-
19
-
20
-
21
-
22
-
23
-
24
-
25
-
26
-
27
-
28
-
29
-
30
-
31
-
32
-
33
-
34
-
35
-
36
-
37
-
38
-
39
-
40
-
41
-
42
-
43
-
44
-
45
-
46
-
47
-
48
-
49
-
50
-
51
-
52
-
53
-
54
-
55
-
56
-
57
-
58
-
59
-
60
-
61
-
62
-
63
-
64
-
65
-
66
-
67
-
68
-
69
-
70
-
71
-
72
-
 73
73 -
 74
74 -
 75
75 -
 76
76 -
 77
77 -
 78
78 -
 79
79 -
 80
80 -
 81
81 -
 82
82 -
 83
83 -
 84
84 -
 85
85 -
 86
86 -
 87
87 -
 88
88 -
 89
89 -
 90
90 -
 91
91 -
 92
92 -
 93
93 -
94
-
95
-
96
-
97
-
98
-
99
-
100
-
101
-
102
-
103
-
104
-
105
-
106
-
107
-
108
-
109
-
110
-
111
-
112
-
113
-
114
-
115
-
116
-
117
-
118
-
119
-
120
-
121
-
122
-
123
-
124
-
125
-
126
-
127
-
128
-
129
-
130
-
131
-
132
-
133
-
134
-
135
-
136
-
137
-
138
-
139
-
140
-
141
-
142
-
143
-
144
-
145
-
146
-
147
-
148
-
149
-
150
-
151
-
152
-
153
-
154
-
155
-
156
-
157
-
158
-
159
-
160
-
161
-
162
-
163
-
164
-
165
-
166
-
167
-
168
-
169
-
170
-
171
-
172
-
173
-
174
-
175
-
176
-
177
-
178
-
179
-
180
-
181
-
182
-
183
-
184
-
185
-
186
-
187
-
188
-
189
-
190
-
191
-
192
-
193
-
194
-
195
-
196
-
197
-
198
-
199
-
200
-
201
-
202
-
203
-
204
-
205
-
206
-
207
-
208
-
209
-
210
-
211
-
212
-
213
-
214
-
215
-
216
-
217
-
218
-
219
-
220
-
221
-
222
-
223
-
224
-
225
-
226
-
227
-
228
-
229
-
230
-
231
-
232
-
233
-
234
-
235
-
236
-
237
-
238
-
239
-
240
-
241
-
242
-
243
-
244
-
245
-
246
-
247
-
248
-
249
-
250
-
251
-
252
-
253
-
254
-
255
-
256
-
257
-
258
-
259
-
260
-
261
-
262
-
263
-
264
-
265
-
266
-
267
-
268
-
269
-
270
-
271
-
272
-
273
-
274
-
275
-
276
-
277
-
278
-
279
-
280
-
281
-
282
-
283
-
284
-
285
-
286
-
287
-
288
-
289
-
290
-
291
-
292
-
293
-
294
-
295
-
296
-
297
-
298
-
299
-
300
-
301
-
302
-
303
-
304
-
305
-
306
-
307
-
308
-
309
-
310
-
311
 |
 |

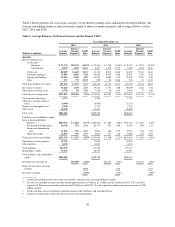
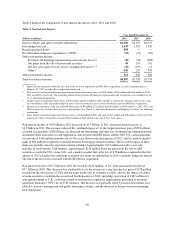
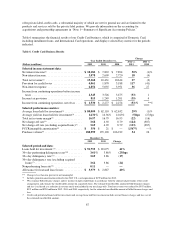
Non-Interest Expense
Non-interest expense consists of ongoing operating costs, such as salaries and associate benefits, occupancy and
equipment costs, professional services, communications and data processing technology expenses, and other
miscellaneous expenses. Non-interest expense also includes marketing costs, merger-related expense and
amortization of intangibles. Table 5 displays the components of non-interest expense for 2012, 2011 and 2010.
Table 5: Non-Interest Expense
(Dollars in millions)
Year Ended December 31,
2012 2011 2010
Salaries and associate benefits ......................................... $ 3,876 $3,023 $2,594
Occupancy and equipment ............................................ 1,327 1,025 1,001
Marketing ......................................................... 1,364 1,337 958
Professional services ................................................. 1,270 1,198 919
Communications and data processing ................................... 778 681 693
Amortization of intangibles ........................................... 609 222 220
Merger-related expense .............................................. 336 45 81
Other non-interest expense:
Collections .................................................... 544 563 626
Fraud losses ................................................... 190 122 80
Bankcard, regulatory and other fee assessments ....................... 525 394 352
Other ......................................................... 1,127 722 410
Total other non-interest expense ........................................ 2,386 1,801 1,468
Total non-interest expense ............................................ $11,946 $9,332 $7,934
Non-interest expense of $11.9 billion for 2012 increased $2.6 billion, or 28%, from 2011. The increase was
primarily due to higher operating expenses and merger-related costs related to our recent acquisitions, increased
salaries and associate benefits attributable to increased headcount, higher infrastructure costs attributable to
acquired businesses and our continued investment in our auto loan business and increased amortization of
intangibles resulting from the ING Direct and 2012 U.S. card acquisitions. We recorded PCCR intangible
amortization expense related to the 2012 U.S. card acquisition of $334 million in 2012. We recorded other asset
and intangible amortization expense related to the ING Direct and 2012 U.S. card acquisitions of $147 million in
2012.
Non-interest expense of $9.3 billion for 2011 increased $1.4 billion, or 18%, from 2010. The increase was
attributable to increased marketing expenditures as we expanded our marketing efforts to attract and support
targeted customers and new business volume through a variety of channels, higher legal expenses and increased
operating expenses. The increase in operating expenses was largely due to the integration of the acquisitions of
the Sony, HBC and Kohl’s loan portfolios and continued investment in our infrastructure.
Income Taxes
We recorded an income tax provision based on income from continuing operations of $1.3 billion (25.8% effective
income tax rate) in 2012, compared with an income tax provision of $1.3 billion (29.1% effective income tax rate)
in 2011 and income tax provision of $1.3 billion (29.6% effective tax rate) in 2010. Our effective tax rate on income
from continuing operations varies between periods due, in part, to fluctuations in our pre-tax earnings, which affects
the relative tax benefit of tax-exempt income, tax credits and other permanent tax items.
The decrease in our effective income tax rate in 2012 from 2011 reflected an increase in the amount of one-time
tax benefits recorded in 2012 compared with the prior year. In 2012, we recorded discrete tax benefits of $252
64