Capital One 2012 Annual Report Download - page 308
Download and view the complete annual report
Please find page 308 of the 2012 Capital One annual report below. You can navigate through the pages in the report by either clicking on the pages listed below, or by using the keyword search tool below to find specific information within the annual report.-
 1
1 -
2
-
3
-
4
-
5
-
6
-
7
-
8
-
9
-
10
-
11
-
12
-
13
-
14
-
15
-
16
-
17
-
18
-
19
-
20
-
21
-
22
-
23
-
24
-
25
-
26
-
27
-
28
-
29
-
30
-
31
-
32
-
33
-
34
-
35
-
36
-
37
-
38
-
39
-
40
-
41
-
42
-
43
-
44
-
45
-
46
-
47
-
48
-
49
-
50
-
51
-
52
-
53
-
54
-
55
-
56
-
57
-
58
-
59
-
60
-
61
-
62
-
63
-
64
-
65
-
66
-
67
-
68
-
69
-
70
-
71
-
72
-
73
-
74
-
75
-
76
-
77
-
78
-
79
-
80
-
81
-
82
-
83
-
84
-
85
-
86
-
87
-
88
-
89
-
90
-
91
-
92
-
93
-
94
-
95
-
96
-
97
-
98
-
99
-
100
-
101
-
102
-
103
-
104
-
105
-
106
-
107
-
108
-
109
-
110
-
111
-
112
-
113
-
114
-
115
-
116
-
117
-
118
-
119
-
120
-
121
-
122
-
123
-
124
-
125
-
126
-
127
-
128
-
129
-
130
-
131
-
132
-
133
-
134
-
135
-
136
-
137
-
138
-
139
-
140
-
141
-
142
-
143
-
144
-
145
-
146
-
147
-
148
-
149
-
150
-
151
-
152
-
153
-
154
-
155
-
156
-
157
-
158
-
159
-
160
-
161
-
162
-
163
-
164
-
165
-
166
-
167
-
168
-
169
-
170
-
171
-
172
-
173
-
174
-
175
-
176
-
177
-
178
-
179
-
180
-
181
-
182
-
183
-
184
-
185
-
186
-
187
-
188
-
189
-
190
-
191
-
192
-
193
-
194
-
195
-
196
-
197
-
198
-
199
-
200
-
201
-
202
-
203
-
204
-
205
-
206
-
207
-
208
-
209
-
210
-
211
-
212
-
213
-
214
-
215
-
216
-
217
-
218
-
219
-
220
-
221
-
222
-
223
-
224
-
225
-
226
-
227
-
228
-
229
-
230
-
231
-
232
-
233
-
234
-
235
-
236
-
237
-
238
-
239
-
240
-
241
-
242
-
243
-
244
-
245
-
246
-
247
-
248
-
249
-
250
-
251
-
252
-
253
-
254
-
255
-
256
-
257
-
258
-
259
-
260
-
261
-
262
-
263
-
264
-
265
-
266
-
267
-
268
-
269
-
270
-
271
-
272
-
273
-
274
-
275
-
276
-
277
-
278
-
279
-
280
-
281
-
282
-
283
-
284
-
285
-
286
-
287
-
288
-
289
-
290
-
291
-
292
-
293
-
294
-
295
-
296
-
297
-
 298
298 -
 299
299 -
 300
300 -
 301
301 -
 302
302 -
 303
303 -
 304
304 -
 305
305 -
 306
306 -
 307
307 -
 308
308 -
 309
309 -
 310
310 -
 311
311
 |
 |

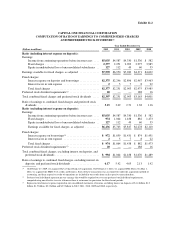
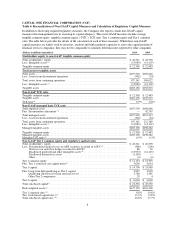
CAPITAL ONE FINANCIAL CORPORATION (COF)
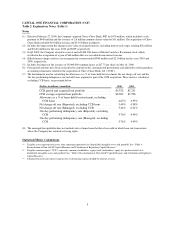
Table 4: Reconciliation of Non-GAAP Capital Measures and Calculation of Regulatory Capital Measures
In addition to disclosing required regulatory measures, the Company also reports certain non-GAAP capital
measures that management uses in assessing its capital adequacy. These non-GAAP measures include average
tangible common equity, tangible common equity (“TCE”), TCE ratio, Tier 1 common equity and Tier 1 common
ratio. The table below provides the details of the calculation of each of these measures. While these non-GAAP
capital measures are widely used by investors, analysts and bank regulatory agencies to assess the capital position of
financial services companies, they may not be comparable to similarly titled measures reported by other companies.
(Dollars in millions)(unaudited) 2010 2009
Stockholders equity to non-GAAP tangible common equity
Total stockholders’ equity ....................................................... $ 26,541 $ 26,590
Less: Intangible assets (1) ........................................................ (13,983) (14,107)
Tangible common equity ........................................................ $ 12,558 $ 12,483
Total assets to tangible assets
Total assets ................................................................... $197,503 $169,646
Less: Assets from discontinued operations .......................................... (362) (24)
Total assets from continuing operations ............................................. 197,141 169,622
Less: Intangible assets (1) ........................................................ (13,983) (14,107)
Tangible assets ................................................................ $183,158 $155,515
Non-GAAP TCE ratio
Tangible common equity ........................................................ $ 12,558 $ 12,483
Tangible assets ................................................................ $183,158 $155,515
TCE ratio(2) ................................................................... 6.9% 8.0%
Non-GAAP managed basis TCE ratio
Total reported assets ............................................................ $197,503 $169,646
Plus: Securitization adjustment (3) ................................................. — 42,767
Total managed assets ........................................................... $197,503 $212,413
Less: Assets from discontinued operations .......................................... (362) (24)
Total assets from continuing operations ............................................. 197,141 212,389
Less: Intangible assets (1) ........................................................ (13,983) (14,107)
Managed tangible assets ......................................................... $183,158 $198,282
Tangible common equity ........................................................ $ 12,558 $ 12,483
Managed tangible assets ......................................................... $183,158 $198,282
Managed TCE ratio (2) .......................................................... 6.9% 6.3%
Non-GAAP Tier 1 common equity and regulatory capital ratios
Total stockholders’ equity ....................................................... $ 26,541 $ 26,590
Less: Net unrealized (gains) losses on AFS securities recorded in AOCI (4) ................. (368) (200)
Net losses on cash flow hedges recorded in AOCI(4) .............................. 86 92
Disallowed goodwill and other intangible assets (5) ............................... (13,953) (14,125)
Disallowed deferred tax assets ............................................... (1,150) —
Other ................................................................... (2) (2)
Tier 1 common equity .......................................................... $ 11,154 $ 12,355
Plus: Tier 1 restricted core capital items(6) ........................................... 3,636 3,634
Tier 1 capital .................................................................. $ 14,790 $ 15,989
Plus: Long-term debt qualifying as Tier 2 capital ..................................... 2,827 3,018
Qualifying allowance for loan and lease losses ................................... 3,748 1,581
Other Tier 2 components .................................................... 29 4
Tier 2 capital .................................................................. $ 6,604 $ 4,603
Total risk-based capital(7) ........................................................ $ 21,394 $ 20,592
Risk-weighted assets(8) .......................................................... $127,132 $116,309
Tier 1 common ratio (9) .......................................................... 8.8% 10.6%
Tier 1 risk-based capital ratio (10) .................................................. 11.6% 13.8%
Total risk-based capital ratio (11) ................................................... 16.8% 17.7%
6