Capital One 2012 Annual Report Download - page 216
Download and view the complete annual report
Please find page 216 of the 2012 Capital One annual report below. You can navigate through the pages in the report by either clicking on the pages listed below, or by using the keyword search tool below to find specific information within the annual report.-
 1
1 -
2
-
3
-
4
-
5
-
6
-
7
-
8
-
9
-
10
-
11
-
12
-
13
-
14
-
15
-
16
-
17
-
18
-
19
-
20
-
21
-
22
-
23
-
24
-
25
-
26
-
27
-
28
-
29
-
30
-
31
-
32
-
33
-
34
-
35
-
36
-
37
-
38
-
39
-
40
-
41
-
42
-
43
-
44
-
45
-
46
-
47
-
48
-
49
-
50
-
51
-
52
-
53
-
54
-
55
-
56
-
57
-
58
-
59
-
60
-
61
-
62
-
63
-
64
-
65
-
66
-
67
-
68
-
69
-
70
-
71
-
72
-
73
-
74
-
75
-
76
-
77
-
78
-
79
-
80
-
81
-
82
-
83
-
84
-
85
-
86
-
87
-
88
-
89
-
90
-
91
-
92
-
93
-
94
-
95
-
96
-
97
-
98
-
99
-
100
-
101
-
102
-
103
-
104
-
105
-
106
-
107
-
108
-
109
-
110
-
111
-
112
-
113
-
114
-
115
-
116
-
117
-
118
-
119
-
120
-
121
-
122
-
123
-
124
-
125
-
126
-
127
-
128
-
129
-
130
-
131
-
132
-
133
-
134
-
135
-
136
-
137
-
138
-
139
-
140
-
141
-
142
-
143
-
144
-
145
-
146
-
147
-
148
-
149
-
150
-
151
-
152
-
153
-
154
-
155
-
156
-
157
-
158
-
159
-
160
-
161
-
162
-
163
-
164
-
165
-
166
-
167
-
168
-
169
-
170
-
171
-
172
-
173
-
174
-
175
-
176
-
177
-
178
-
179
-
180
-
181
-
182
-
183
-
184
-
185
-
186
-
187
-
188
-
189
-
190
-
191
-
192
-
193
-
194
-
195
-
196
-
197
-
198
-
199
-
200
-
201
-
202
-
203
-
204
-
205
-
 206
206 -
 207
207 -
 208
208 -
 209
209 -
 210
210 -
 211
211 -
 212
212 -
 213
213 -
 214
214 -
 215
215 -
 216
216 -
 217
217 -
 218
218 -
 219
219 -
 220
220 -
 221
221 -
 222
222 -
 223
223 -
 224
224 -
 225
225 -
 226
226 -
227
-
228
-
229
-
230
-
231
-
232
-
233
-
234
-
235
-
236
-
237
-
238
-
239
-
240
-
241
-
242
-
243
-
244
-
245
-
246
-
247
-
248
-
249
-
250
-
251
-
252
-
253
-
254
-
255
-
256
-
257
-
258
-
259
-
260
-
261
-
262
-
263
-
264
-
265
-
266
-
267
-
268
-
269
-
270
-
271
-
272
-
273
-
274
-
275
-
276
-
277
-
278
-
279
-
280
-
281
-
282
-
283
-
284
-
285
-
286
-
287
-
288
-
289
-
290
-
291
-
292
-
293
-
294
-
295
-
296
-
297
-
298
-
299
-
300
-
301
-
302
-
303
-
304
-
305
-
306
-
307
-
308
-
309
-
310
-
311
 |
 |

CAPITAL ONE FINANCIAL CORPORATION
NOTES TO CONSOLIDATED FINANCIAL STATEMENTS—(Continued)
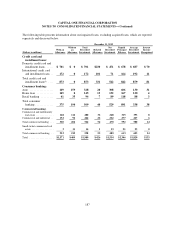
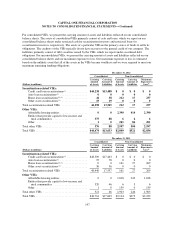
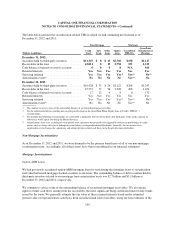
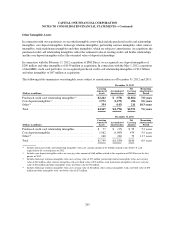
For consolidated VIEs, we present the carrying amount of assets and liabilities reflected on our consolidated
balance sheets. The assets of consolidated VIEs primarily consist of cash and loans, which we report on our
consolidated balance sheets under restricted cash for securitization investors and restricted loans for
securitization investors, respectively. The assets of a particular VIE are the primary source of funds to settle its
obligations. The creditors of the VIEs typically do not have recourse to the general credit of our company. The
liabilities primarily consist of debt securities issued by the VIEs, which we report under securitized debt
obligations. For unconsolidated VIEs, we present the carrying amount of assets and liabilities reflected on our
consolidated balance sheets and our maximum exposure to loss. Our maximum exposure to loss is estimated
based on the unlikely event that all of the assets in the VIEs became worthless and we were required to meet our
maximum remaining funding obligations.
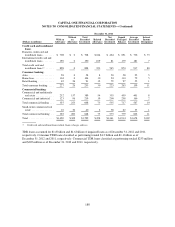
December 31, 2012
Consolidated Non-Consolidated
(Dollars in millions)
Carrying
Amount
of Assets
Carrying
Amount of
Liabilities
Carrying
Amount
of Assets
Carrying
Amount of
Liabilities
Maximum
Exposure to
Loss(4)
Securitization-related VIEs:
Credit card loan securitizations(1) .............. $44,238 $13,488 $ 0 $ 0 $ 0
Auto loan securitizations(1) ................... 0 0 00 0
Home loan securitizations(2) (3) ................ 41 38 212 17 237
Other asset securitizations(1) .................. 19 19 0 0 0
Total securitization-related VIEs .................. 44,298 13,545 212 17 237
Other VIEs:
Affordable housing entities ................... 0 0 2,390 414 2,390
Entities that provide capital to low-income and
rural communities ........................ 375 88 6 4 6
Other .................................... 1 0 201 86 201
Total other VIEs ............................... 376 88 2,597 504 2,597
Total VIEs .................................... $44,674 $13,633 $2,809 $521 $2,834
December 31, 2011
Consolidated Non-Consolidated
(Dollars in millions)
Carrying
Amount
of Assets
Carrying
Amount of
Liabilities
Carrying
Amount
of Assets
Carrying
Amount of
Liabilities
Maximum
Exposure to
Loss(4)
Securitization-related VIEs:
Credit card loan securitizations(1) .............. $48,309 $17,443 $ 0 $ 0 $ 0
Auto loan securitizations(1) ................... 95 78 0 0 0
Home loan securitizations(2) (3) ................ 0 0 161 27 269
Other asset securitizations(1) .................. 36 36 0 0 0
Total securitization-related VIEs .................. 48,440 17,557 161 27 269
Other VIEs:
Affordable housing entities ................... 0 0 1,818 243 1,818
Entities that provide capital to low-income and
rural communities ........................ 320 46 6 3 6
Other .................................... 1 0 139 0 139
Total other VIEs ............................... 321 46 1,963 246 1,963
Total VIEs .................................... $48,761 $17,603 $2,124 $273 $2,232
197