Capital One 2012 Annual Report Download - page 259
Download and view the complete annual report
Please find page 259 of the 2012 Capital One annual report below. You can navigate through the pages in the report by either clicking on the pages listed below, or by using the keyword search tool below to find specific information within the annual report.-
 1
1 -
2
-
3
-
4
-
5
-
6
-
7
-
8
-
9
-
10
-
11
-
12
-
13
-
14
-
15
-
16
-
17
-
18
-
19
-
20
-
21
-
22
-
23
-
24
-
25
-
26
-
27
-
28
-
29
-
30
-
31
-
32
-
33
-
34
-
35
-
36
-
37
-
38
-
39
-
40
-
41
-
42
-
43
-
44
-
45
-
46
-
47
-
48
-
49
-
50
-
51
-
52
-
53
-
54
-
55
-
56
-
57
-
58
-
59
-
60
-
61
-
62
-
63
-
64
-
65
-
66
-
67
-
68
-
69
-
70
-
71
-
72
-
73
-
74
-
75
-
76
-
77
-
78
-
79
-
80
-
81
-
82
-
83
-
84
-
85
-
86
-
87
-
88
-
89
-
90
-
91
-
92
-
93
-
94
-
95
-
96
-
97
-
98
-
99
-
100
-
101
-
102
-
103
-
104
-
105
-
106
-
107
-
108
-
109
-
110
-
111
-
112
-
113
-
114
-
115
-
116
-
117
-
118
-
119
-
120
-
121
-
122
-
123
-
124
-
125
-
126
-
127
-
128
-
129
-
130
-
131
-
132
-
133
-
134
-
135
-
136
-
137
-
138
-
139
-
140
-
141
-
142
-
143
-
144
-
145
-
146
-
147
-
148
-
149
-
150
-
151
-
152
-
153
-
154
-
155
-
156
-
157
-
158
-
159
-
160
-
161
-
162
-
163
-
164
-
165
-
166
-
167
-
168
-
169
-
170
-
171
-
172
-
173
-
174
-
175
-
176
-
177
-
178
-
179
-
180
-
181
-
182
-
183
-
184
-
185
-
186
-
187
-
188
-
189
-
190
-
191
-
192
-
193
-
194
-
195
-
196
-
197
-
198
-
199
-
200
-
201
-
202
-
203
-
204
-
205
-
206
-
207
-
208
-
209
-
210
-
211
-
212
-
213
-
214
-
215
-
216
-
217
-
218
-
219
-
220
-
221
-
222
-
223
-
224
-
225
-
226
-
227
-
228
-
229
-
230
-
231
-
232
-
233
-
234
-
235
-
236
-
237
-
238
-
239
-
240
-
241
-
242
-
243
-
244
-
245
-
246
-
247
-
248
-
 249
249 -
 250
250 -
 251
251 -
 252
252 -
 253
253 -
 254
254 -
 255
255 -
 256
256 -
 257
257 -
 258
258 -
 259
259 -
 260
260 -
 261
261 -
 262
262 -
 263
263 -
 264
264 -
 265
265 -
 266
266 -
 267
267 -
 268
268 -
 269
269 -
270
-
271
-
272
-
273
-
274
-
275
-
276
-
277
-
278
-
279
-
280
-
281
-
282
-
283
-
284
-
285
-
286
-
287
-
288
-
289
-
290
-
291
-
292
-
293
-
294
-
295
-
296
-
297
-
298
-
299
-
300
-
301
-
302
-
303
-
304
-
305
-
306
-
307
-
308
-
309
-
310
-
311
 |
 |
CAPITAL ONE FINANCIAL CORPORATION
NOTES TO CONSOLIDATED FINANCIAL STATEMENTS—(Continued)
Fair Value Governance and Control
We have a governance framework and a number of key controls that are intended to ensure that our fair value
measurements are appropriate and reliable. Our governance framework provides for independent oversight and
segregation of duties. Our control processes include review and approval of new transaction types, price
verification and review of valuation judgments, methods, models, process controls and results. Groups
independent from our trading and investing functions, including our Valuations Group, Model Validation Group
and Fair Value Committee (“FVC”), participate in the review and validation process. The fair valuation
governance process is set up in a manner that allows the Chairperson of the FVC to escalate valuation disputes
that cannot be resolved at the FVC to a more senior committee called the Valuations Advisory Committee
(“VAC”) for resolution. The VAC is chaired by the Chief Financial Officer. Membership of the VAC includes
the Chief Risk Officer.
Our Valuations Group performs periodic independent verification of fair value measurements by using
independent analytics and other available market data to determine if assigned fair values are reasonable. For
example, in cases where we rely on third party pricing services to obtain fair value measures, we analyze pricing
variances among different pricing sources and validate the final price used by comparing the information to
additional sources, including dealer pricing indications in transaction results and other internal sources, where
necessary. Additional validation procedures performed by the Valuations Group include reviewing (either
directly or indirectly through the reasonableness of assigned fair values) valuation inputs and assumptions, and
monitoring acceptable variances between recommended prices and validation prices. The validation group
periodically evaluates alternative methodologies and recommends improvements to valuation techniques. We
perform due diligence reviews of the third party pricing services by comparing their prices with prices from other
sources and reviewing other control documentation. Additionally, when necessary, we challenge prices from
third party vendors to ensure reasonableness of prices through a pricing challenge process. This may include a
request for a transparency of the assumptions used by the third party.
The FVC, which includes representation from business areas, our Risk Management division and our Finance
division, is a forum for discussing fair valuations, inputs, assumptions, methodologies, variance thresholds,
valuation control environment and material risks or concerns related to fair valuations. Additionally, the FVC is
empowered to resolve valuation disputes between the primary valuation providers and the valuations control
group. It provides guidance and oversight to ensure an appropriate valuation control environment. The FVC
regularly reviews and approves our valuation methodologies to ensure that our methodologies and practices are
consistent with industry standards and adhere to regulatory and accounting guidance. The Chief Financial Officer
determines when material issues or concerns regarding valuations shall be raised to the Audit and Risk
Committee or other delegated committee of the Board of Directors.
We have a model policy, established by an independent Model Risk Office, which governs the validation of
models and related supporting documentation to ensure the appropriate use of models for pricing.
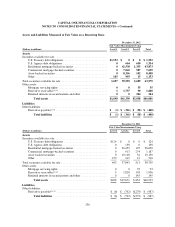
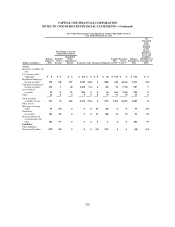
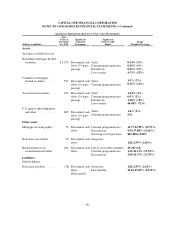
Assets and Liabilities Measured at Fair Value on a Recurring Basis
The following table presents the significant unobservable inputs relied upon to determine the fair values of our
recurring Level 3 financial instruments. We utilize multiple third party pricing services to obtain fair value
measures for our securities. Several of our third party pricing services are only able to provide unobservable
input information for a limited number of securities due to software licensing restrictions. Other third party
pricing services are able to provide unobservable input information for all securities for which they provide a
valuation. As a result, the unobservable input information for the available-for-sale securities presented below
represents a composite summary of all information we are able to obtain for a majority of our securities. The
unobservable input information for all other Level 3 financial instruments is based on the assumptions used in
our internal valuation models.
240