Capital One 2012 Annual Report Download - page 146
Download and view the complete annual report
Please find page 146 of the 2012 Capital One annual report below. You can navigate through the pages in the report by either clicking on the pages listed below, or by using the keyword search tool below to find specific information within the annual report.-
 1
1 -
2
-
3
-
4
-
5
-
6
-
7
-
8
-
9
-
10
-
11
-
12
-
13
-
14
-
15
-
16
-
17
-
18
-
19
-
20
-
21
-
22
-
23
-
24
-
25
-
26
-
27
-
28
-
29
-
30
-
31
-
32
-
33
-
34
-
35
-
36
-
37
-
38
-
39
-
40
-
41
-
42
-
43
-
44
-
45
-
46
-
47
-
48
-
49
-
50
-
51
-
52
-
53
-
54
-
55
-
56
-
57
-
58
-
59
-
60
-
61
-
62
-
63
-
64
-
65
-
66
-
67
-
68
-
69
-
70
-
71
-
72
-
73
-
74
-
75
-
76
-
77
-
78
-
79
-
80
-
81
-
82
-
83
-
84
-
85
-
86
-
87
-
88
-
89
-
90
-
91
-
92
-
93
-
94
-
95
-
96
-
97
-
98
-
99
-
100
-
101
-
102
-
103
-
104
-
105
-
106
-
107
-
108
-
109
-
110
-
111
-
112
-
113
-
114
-
115
-
116
-
117
-
118
-
119
-
120
-
121
-
122
-
123
-
124
-
125
-
126
-
127
-
128
-
129
-
130
-
131
-
132
-
133
-
134
-
135
-
 136
136 -
 137
137 -
 138
138 -
 139
139 -
 140
140 -
 141
141 -
 142
142 -
 143
143 -
 144
144 -
 145
145 -
 146
146 -
 147
147 -
 148
148 -
 149
149 -
 150
150 -
 151
151 -
 152
152 -
 153
153 -
 154
154 -
 155
155 -
 156
156 -
157
-
158
-
159
-
160
-
161
-
162
-
163
-
164
-
165
-
166
-
167
-
168
-
169
-
170
-
171
-
172
-
173
-
174
-
175
-
176
-
177
-
178
-
179
-
180
-
181
-
182
-
183
-
184
-
185
-
186
-
187
-
188
-
189
-
190
-
191
-
192
-
193
-
194
-
195
-
196
-
197
-
198
-
199
-
200
-
201
-
202
-
203
-
204
-
205
-
206
-
207
-
208
-
209
-
210
-
211
-
212
-
213
-
214
-
215
-
216
-
217
-
218
-
219
-
220
-
221
-
222
-
223
-
224
-
225
-
226
-
227
-
228
-
229
-
230
-
231
-
232
-
233
-
234
-
235
-
236
-
237
-
238
-
239
-
240
-
241
-
242
-
243
-
244
-
245
-
246
-
247
-
248
-
249
-
250
-
251
-
252
-
253
-
254
-
255
-
256
-
257
-
258
-
259
-
260
-
261
-
262
-
263
-
264
-
265
-
266
-
267
-
268
-
269
-
270
-
271
-
272
-
273
-
274
-
275
-
276
-
277
-
278
-
279
-
280
-
281
-
282
-
283
-
284
-
285
-
286
-
287
-
288
-
289
-
290
-
291
-
292
-
293
-
294
-
295
-
296
-
297
-
298
-
299
-
300
-
301
-
302
-
303
-
304
-
305
-
306
-
307
-
308
-
309
-
310
-
311
 |
 |

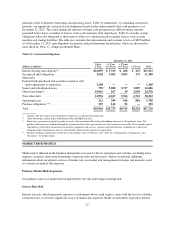
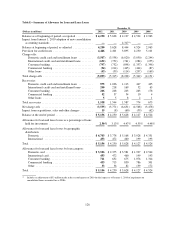
Table F— Reconciliation of Non-Gaap Measures and Calculation of Regulatory Capital Measures Under Basel I
December 31,
(Dollars in millions) 2012 2011 2010 2009 2008
Stockholders’ equity to non-GAAP tangible common equity
Total stockholders’ equity .................................. $ 40,499 $ 29,666 $ 26,541 $ 26,590 $ 26,611
Less: Intangible assets(1) ................................... (16,224) (13,908) (13,983) (14,107) (12,445)
Noncumulative perpetual preferred stock(2) ................ (853) ————
Tangible common equity ................................... $ 23,422 $ 15,758 $ 12,558 $ 12,483 $ 14,166
Total assets to tangible assets
Total assets ............................................. $312,918 $206,019 $197,503 $169,646 $165,913
Less: Assets from discontinued operations ..................... (309) (305) (362) (24) —
Total assets from continuing operations ....................... 312,609 205,714 197,141 169,622 165,913
Less: Intangible assets(1) ................................... (16,224) (13,908) (13,983) (14,107) (12,445)
Tangible assets .......................................... $296,385 $191,806 $183,158 $155,515 $153,468
Non-GAAP TCE ratio
Tangible common equity ................................... $ 23,422 $ 15,758 $ 12,558 $ 12,483 $ 14,166
Tangible assets .......................................... 296,385 191,806 183,158 155,515 153,468
TCE ratio(3) ............................................. 7.9% 8.2% 6.9% 8.0% 9.2%
Regulatory capital ratios
Total stockholders’ equity .................................. $ 40,499 $ 29,666 $ 26,541 $ 26,590 $ 26,611
Less: Net unrealized losses (gains) on securities available for sale
recorded in AOCI(4) .................................. (712) (289) (368) (200) 783
Net losses on cash flow hedges recorded in AOCI(4) ........ 271 86 92 215
Disallowed goodwill and other intangible assets(5) .......... (14,428) (13,855) (13,953) (14,125) (12,482)
Disallowed deferred tax assets .......................... —(534) (1,150) — —
Noncumulative perpetual preferred stock(2) ................ (853) ————
Other ............................................. (12) (2) (2) (2) (2)
Tier 1 common capital ..................................... 24,496 15,057 11,154 12,355 15,125
Plus: Noncumulative perpetual preferred stock(2) ................ 853 ————
Tier 1 restricted core capital items(6) ..................... 23,635 3,636 3,634 1,642
Tier 1 capital ............................................ 25,351 18,692 14,790 15,989 16,767
Plus: Long-term debt qualifying as Tier 2 capital ................ 2,119 2,438 2,827 3,018 1,813
Qualifying allowance for loan and lease losses ............. 2,830 1,979 3,748 1,581 1,630
Other Tier 2 components .............................. 13 23 29 4 1
Tier 2 capital ............................................ 4,962 4,440 6,604 4,603 3,444
Total risk-based capital(7) .................................. $ 30,313 $ 23,132 $ 21,394 $ 20,592 $ 20,211
Risk-weighted assets(8) .................................... $223,472 $155,657 $127,132 $116,309 $121,380
Tier 1 common ratio(9) ..................................... 11.0% 9.7% 8.8% 10.6% 12.5%
Tier 1 risk-based capital ratio(10) ............................. 11.3 12.0 11.6 13.8 13.8
Total risk-based capital ratio(11) .............................. 13.6 14.9 16.8 17.7 16.7
(1) Includes impact from related deferred taxes.
(2) Noncumulative perpetual preferred stock qualifies as Tier 1 capital; however, it does not qualify as Tier 1 common capital.
(3) Calculated based on tangible common equity divided by tangible assets.
(4) Amounts presented are net of tax.
(5) Disallowed goodwill and other intangible assets are net of related deferred tax liability.
(6) Consists primarily of trust preferred securities.
(7) Total risk-based capital equals the sum of Tier 1 capital and Tier 2 capital.
(8) Calculated based on prescribed regulatory guidelines.
(9) Tier 1 common ratio is a regulatory capital measure calculated based on Tier 1 common capital divided by risk-weighted assets.
(10) Tier 1 risk-based capital ratio is a regulatory capital measure calculated based on Tier 1 capital divided by risk-weighted assets.
(11) Total risk-based capital ratio is a regulatory capital measure calculated based on total risk-based capital divided by risk-weighted assets.
127