Capital One 2012 Annual Report Download - page 95
Download and view the complete annual report
Please find page 95 of the 2012 Capital One annual report below. You can navigate through the pages in the report by either clicking on the pages listed below, or by using the keyword search tool below to find specific information within the annual report.-
 1
1 -
2
-
3
-
4
-
5
-
6
-
7
-
8
-
9
-
10
-
11
-
12
-
13
-
14
-
15
-
16
-
17
-
18
-
19
-
20
-
21
-
22
-
23
-
24
-
25
-
26
-
27
-
28
-
29
-
30
-
31
-
32
-
33
-
34
-
35
-
36
-
37
-
38
-
39
-
40
-
41
-
42
-
43
-
44
-
45
-
46
-
47
-
48
-
49
-
50
-
51
-
52
-
53
-
54
-
55
-
56
-
57
-
58
-
59
-
60
-
61
-
62
-
63
-
64
-
65
-
66
-
67
-
68
-
69
-
70
-
71
-
72
-
73
-
74
-
75
-
76
-
77
-
78
-
79
-
80
-
81
-
82
-
83
-
84
-
 85
85 -
 86
86 -
 87
87 -
 88
88 -
 89
89 -
 90
90 -
 91
91 -
 92
92 -
 93
93 -
 94
94 -
 95
95 -
 96
96 -
 97
97 -
 98
98 -
 99
99 -
 100
100 -
 101
101 -
 102
102 -
 103
103 -
 104
104 -
 105
105 -
106
-
107
-
108
-
109
-
110
-
111
-
112
-
113
-
114
-
115
-
116
-
117
-
118
-
119
-
120
-
121
-
122
-
123
-
124
-
125
-
126
-
127
-
128
-
129
-
130
-
131
-
132
-
133
-
134
-
135
-
136
-
137
-
138
-
139
-
140
-
141
-
142
-
143
-
144
-
145
-
146
-
147
-
148
-
149
-
150
-
151
-
152
-
153
-
154
-
155
-
156
-
157
-
158
-
159
-
160
-
161
-
162
-
163
-
164
-
165
-
166
-
167
-
168
-
169
-
170
-
171
-
172
-
173
-
174
-
175
-
176
-
177
-
178
-
179
-
180
-
181
-
182
-
183
-
184
-
185
-
186
-
187
-
188
-
189
-
190
-
191
-
192
-
193
-
194
-
195
-
196
-
197
-
198
-
199
-
200
-
201
-
202
-
203
-
204
-
205
-
206
-
207
-
208
-
209
-
210
-
211
-
212
-
213
-
214
-
215
-
216
-
217
-
218
-
219
-
220
-
221
-
222
-
223
-
224
-
225
-
226
-
227
-
228
-
229
-
230
-
231
-
232
-
233
-
234
-
235
-
236
-
237
-
238
-
239
-
240
-
241
-
242
-
243
-
244
-
245
-
246
-
247
-
248
-
249
-
250
-
251
-
252
-
253
-
254
-
255
-
256
-
257
-
258
-
259
-
260
-
261
-
262
-
263
-
264
-
265
-
266
-
267
-
268
-
269
-
270
-
271
-
272
-
273
-
274
-
275
-
276
-
277
-
278
-
279
-
280
-
281
-
282
-
283
-
284
-
285
-
286
-
287
-
288
-
289
-
290
-
291
-
292
-
293
-
294
-
295
-
296
-
297
-
298
-
299
-
300
-
301
-
302
-
303
-
304
-
305
-
306
-
307
-
308
-
309
-
310
-
311
 |
 |
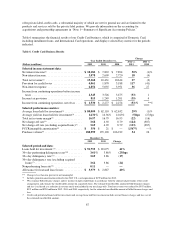
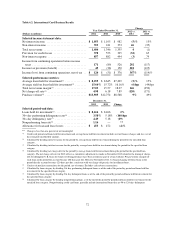
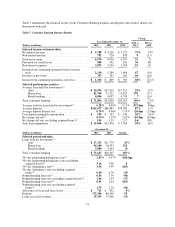
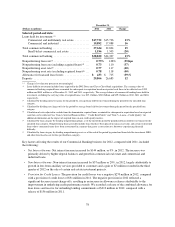
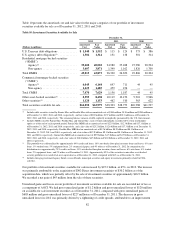
•Deposits: Period-end deposits in the Consumer Banking business increased by $83.9 billion, or 95%, in 2012 to
$172.4 billion as of December 31, 2012, primarily due to the addition of ING Direct deposits of $84.4 billion.
•Charge-off and Delinquency Statistics: The net charge-off rate decreased to 0.74% in 2012, from 1.39% in
2011. The 30+ day delinquency rate decreased to 3.34% as of December 31, 2012, from 5.99% as of
December 31, 2011. The improvement in our reported net charge-off and delinquency rates for our
Consumer Banking business reflects the impact of the addition of the ING Direct home loan portfolio. As
discussed above, because the credit mark established at acquisition for these loans takes into consideration
future credit losses expected to be incurred, there are no charge-offs or an allowance associated with these
loans unless the estimated cash flows expected to be collected decrease subsequent to acquisition. In
addition, these loans are not classified as delinquent or nonperforming even though the customer may be
contractually past due because we expect that we will fully collect the carrying value of these loans. The
overall improvement in credit quality metrics, excluding acquired loans, reflects improved credit
performance in our legacy consumer loan portfolios.
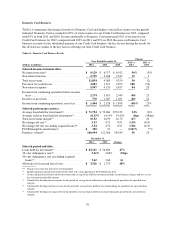
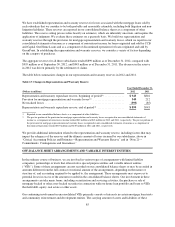
Key factors affecting the results of our Consumer Banking business for 2011, compared with 2010, included the
following:
•Net Interest Income: Net interest income increased by $509 million, or 14%, in 2011. The primary drivers of
the increase in net interest income were improved loan margins attributable to an increase in average loan
yields, coupled with a decrease in the cost of funds. The increase in loan yields reflected the shift in product
mix as we replaced the legacy home loan run-off with higher yielding auto loans. The decrease in the cost of
funds reflected reduced deposit interest rates due to the prevailing low interest rate environment, combined
with our disciplined pricing. Average interest on deposits decreased to 0.96% in 2011 from 1.19% in 2010
while period end deposits grew by 7% in 2011 compared to 2010.
•Non-Interest Income: Non-interest income decreased by $150 million, or 17%, in 2011. The decrease in
non-interest income was primarily attributable to the combined impact of the absence of a net gain of
$128 million recorded in the first quarter of 2010 related to the deconsolidation of certain option-adjustable
rate mortgage trusts that were consolidated on January 1, 2010 as a result of our adoption of the new
consolidation accounting standards, and the absence of an impairment charge on mortgage servicing rights
recorded in the second quarter of 2010.
•Provision for Credit Losses: The provision for credit losses increased by $211 million in 2011 to
$452 million. Although we experienced continued improvement in credit performance in our Consumer
Banking business, including reduced net charge-off rates, we recorded a higher provision for loan and lease
losses in 2011 relative to 2010 due to the absence of significant allowance releases that we experienced in
2010, growth in our auto loan portfolio and an increase in the allowance for home equity loans we acquired
from Chevy Chase Bank.
•Non-Interest Expense: Non-interest expense increased by $294 million, or 10%, in 2011. The increase was
largely attributable to the recognition of expense for contingent payments related to recent acquisitions,
higher infrastructure expenditures resulting from investments in our home loan business, growth in auto
originations and modestly higher marketing expenditures in our retail banking operations.
•Total Loans: Period-end loans in the Consumer Banking business increased by $1.9 billion, or 6%, in 2011
to $36.3 billion as of December 31, 2011, primarily due to growth in auto loans that was partially offset by
the continued run-off of our legacy home loan portfolios.
•Deposits: Period-end deposits in the Consumer Banking business increased by $5.6 billion, or 7%, in 2011
to $88.5 billion as of December 31, 2011, reflecting the impact of our strategy to replace maturing higher
cost wholesale funding sources with lower cost funding sources and our continued retail marketing efforts to
attract new business to meet this objective.
•Charge-off and Delinquency Statistics: The net charge-off rate decreased to 1.39% in 2011, from 1.82% in
2010. The 30+ day delinquency rate was 5.99% as of December 31, 2011, compared with 5.96% as of
76