Capital One 2012 Annual Report Download - page 125
Download and view the complete annual report
Please find page 125 of the 2012 Capital One annual report below. You can navigate through the pages in the report by either clicking on the pages listed below, or by using the keyword search tool below to find specific information within the annual report.-
 1
1 -
2
-
3
-
4
-
5
-
6
-
7
-
8
-
9
-
10
-
11
-
12
-
13
-
14
-
15
-
16
-
17
-
18
-
19
-
20
-
21
-
22
-
23
-
24
-
25
-
26
-
27
-
28
-
29
-
30
-
31
-
32
-
33
-
34
-
35
-
36
-
37
-
38
-
39
-
40
-
41
-
42
-
43
-
44
-
45
-
46
-
47
-
48
-
49
-
50
-
51
-
52
-
53
-
54
-
55
-
56
-
57
-
58
-
59
-
60
-
61
-
62
-
63
-
64
-
65
-
66
-
67
-
68
-
69
-
70
-
71
-
72
-
73
-
74
-
75
-
76
-
77
-
78
-
79
-
80
-
81
-
82
-
83
-
84
-
85
-
86
-
87
-
88
-
89
-
90
-
91
-
92
-
93
-
94
-
95
-
96
-
97
-
98
-
99
-
100
-
101
-
102
-
103
-
104
-
105
-
106
-
107
-
108
-
109
-
110
-
111
-
112
-
113
-
114
-
 115
115 -
 116
116 -
 117
117 -
 118
118 -
 119
119 -
 120
120 -
 121
121 -
 122
122 -
 123
123 -
 124
124 -
 125
125 -
 126
126 -
 127
127 -
 128
128 -
 129
129 -
 130
130 -
 131
131 -
 132
132 -
 133
133 -
 134
134 -
 135
135 -
136
-
137
-
138
-
139
-
140
-
141
-
142
-
143
-
144
-
145
-
146
-
147
-
148
-
149
-
150
-
151
-
152
-
153
-
154
-
155
-
156
-
157
-
158
-
159
-
160
-
161
-
162
-
163
-
164
-
165
-
166
-
167
-
168
-
169
-
170
-
171
-
172
-
173
-
174
-
175
-
176
-
177
-
178
-
179
-
180
-
181
-
182
-
183
-
184
-
185
-
186
-
187
-
188
-
189
-
190
-
191
-
192
-
193
-
194
-
195
-
196
-
197
-
198
-
199
-
200
-
201
-
202
-
203
-
204
-
205
-
206
-
207
-
208
-
209
-
210
-
211
-
212
-
213
-
214
-
215
-
216
-
217
-
218
-
219
-
220
-
221
-
222
-
223
-
224
-
225
-
226
-
227
-
228
-
229
-
230
-
231
-
232
-
233
-
234
-
235
-
236
-
237
-
238
-
239
-
240
-
241
-
242
-
243
-
244
-
245
-
246
-
247
-
248
-
249
-
250
-
251
-
252
-
253
-
254
-
255
-
256
-
257
-
258
-
259
-
260
-
261
-
262
-
263
-
264
-
265
-
266
-
267
-
268
-
269
-
270
-
271
-
272
-
273
-
274
-
275
-
276
-
277
-
278
-
279
-
280
-
281
-
282
-
283
-
284
-
285
-
286
-
287
-
288
-
289
-
290
-
291
-
292
-
293
-
294
-
295
-
296
-
297
-
298
-
299
-
300
-
301
-
302
-
303
-
304
-
305
-
306
-
307
-
308
-
309
-
310
-
311
 |
 |

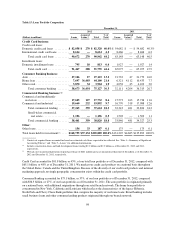
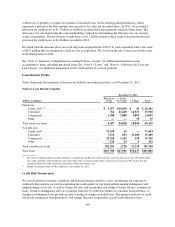
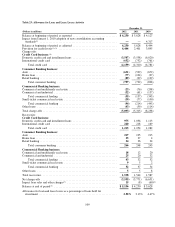
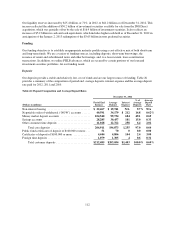
(3) The carrying value of acquired loans accounted for based on estimated expected cash flows to be collected was $37.1 billion, $4.7 billion
and $5.6 billion as of December 31, 2012, 2011 and 2010, respectively.
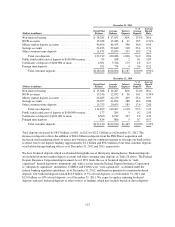
In the third quarter of 2012, the OCC issued an update to the Bank Accounting Advisory Series requiring the
write-down to collateral value of performing consumer loans that have been restructured in bankruptcy. We
recognized additional charge-offs of $25 million in the third quarter of 2012, which are reflected in Table 21
above, pursuant to the OCC’s guidance.
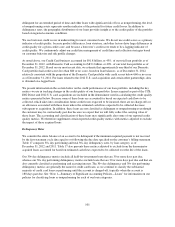
Loan Modifications and Restructurings
As part of our customer retention efforts, we may modify loans for certain borrowers who have demonstrated
performance under the previous terms. As part of our loss mitigation efforts, we may make loan modifications to
a borrower experiencing financial difficulty that are intended to minimize our economic loss and avoid the need
for foreclosure or repossession of collateral. We may provide short-term (three to twelve months) or long-term
(greater than twelve months) modifications to improve the long-term collectability of the loan. Our most
common types of modifications include a reduction in the borrower’s initial monthly or quarterly principal and
interest payment through an extension of the loan term, a reduction in the interest rate, or a combination of both.
These modifications may result in our receiving the full amount due, or certain installments due, under the loan
over a period of time that is longer than the period of time originally provided for under the terms of the loan. In
some cases, we may curtail the amount of principal owed by the borrower. Loan modifications in which a
concession has been granted to a borrower experiencing financial difficulty are accounted for and reported as
TDRs. We also classify loan modifications that involve a trial period as TDRs.
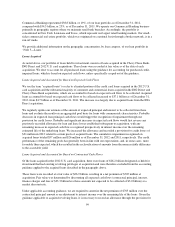
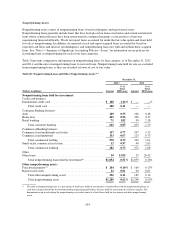
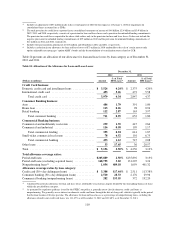
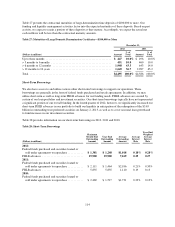
Table 22 presents the loan balances as of December 31, 2012 and 2011 of loan modifications made as part of our
loss mitigation efforts, all of which are considered to be TDRs. Table 22 excludes loan modifications that do not
meet the definition of a TDR and acquired loans accounted for based on expected cash flows, which we track and
report separately.
Table 22: Loan Modifications and Restructurings
December 31,
(Dollars in millions) 2012 2011
Modified and restructured loans:
Credit card(1) ................................................................. $ 873 $ 898
Auto ........................................................................ 328 58
Home loan ................................................................... 145 104
Retail banking ................................................................ 65 80
Commercial banking ........................................................... 383 426
Total ................................................................... $1,794 $1,566
Status of modified and restructured loans:
Performing ................................................................... $1,419 $1,396
Nonperforming ............................................................... 375 170
Total ................................................................... $1,794 $1,566
(1) Amount reported reflects the total outstanding customer balance, which consists of unpaid principal balance, accrued interest and fees.
The outstanding balance of loan modifications made to assist borrowers experiencing financial difficulties
increased to $1.8 billion as of December 31, 2012, from $1.6 billion as of December 31, 2011. Of these
modifications, approximately $375 million, or 21%, were classified as nonperforming as of December 31, 2012,
compared with $170 million, or 11%, as of December 31, 2011.
106