Capital One 2012 Annual Report Download - page 3
Download and view the complete annual report
Please find page 3 of the 2012 Capital One annual report below. You can navigate through the pages in the report by either clicking on the pages listed below, or by using the keyword search tool below to find specific information within the annual report.-
 1
1 -
 2
2 -
 3
3 -
 4
4 -
 5
5 -
 6
6 -
 7
7 -
 8
8 -
 9
9 -
 10
10 -
 11
11 -
 12
12 -
 13
13 -
 14
14 -
15
-
16
-
17
-
18
-
19
-
20
-
21
-
22
-
23
-
24
-
25
-
26
-
27
-
28
-
29
-
30
-
31
-
32
-
33
-
34
-
35
-
36
-
37
-
38
-
39
-
40
-
41
-
42
-
43
-
44
-
45
-
46
-
47
-
48
-
49
-
50
-
51
-
52
-
53
-
54
-
55
-
56
-
57
-
58
-
59
-
60
-
61
-
62
-
63
-
64
-
65
-
66
-
67
-
68
-
69
-
70
-
71
-
72
-
73
-
74
-
75
-
76
-
77
-
78
-
79
-
80
-
81
-
82
-
83
-
84
-
85
-
86
-
87
-
88
-
89
-
90
-
91
-
92
-
93
-
94
-
95
-
96
-
97
-
98
-
99
-
100
-
101
-
102
-
103
-
104
-
105
-
106
-
107
-
108
-
109
-
110
-
111
-
112
-
113
-
114
-
115
-
116
-
117
-
118
-
119
-
120
-
121
-
122
-
123
-
124
-
125
-
126
-
127
-
128
-
129
-
130
-
131
-
132
-
133
-
134
-
135
-
136
-
137
-
138
-
139
-
140
-
141
-
142
-
143
-
144
-
145
-
146
-
147
-
148
-
149
-
150
-
151
-
152
-
153
-
154
-
155
-
156
-
157
-
158
-
159
-
160
-
161
-
162
-
163
-
164
-
165
-
166
-
167
-
168
-
169
-
170
-
171
-
172
-
173
-
174
-
175
-
176
-
177
-
178
-
179
-
180
-
181
-
182
-
183
-
184
-
185
-
186
-
187
-
188
-
189
-
190
-
191
-
192
-
193
-
194
-
195
-
196
-
197
-
198
-
199
-
200
-
201
-
202
-
203
-
204
-
205
-
206
-
207
-
208
-
209
-
210
-
211
-
212
-
213
-
214
-
215
-
216
-
217
-
218
-
219
-
220
-
221
-
222
-
223
-
224
-
225
-
226
-
227
-
228
-
229
-
230
-
231
-
232
-
233
-
234
-
235
-
236
-
237
-
238
-
239
-
240
-
241
-
242
-
243
-
244
-
245
-
246
-
247
-
248
-
249
-
250
-
251
-
252
-
253
-
254
-
255
-
256
-
257
-
258
-
259
-
260
-
261
-
262
-
263
-
264
-
265
-
266
-
267
-
268
-
269
-
270
-
271
-
272
-
273
-
274
-
275
-
276
-
277
-
278
-
279
-
280
-
281
-
282
-
283
-
284
-
285
-
286
-
287
-
288
-
289
-
290
-
291
-
292
-
293
-
294
-
295
-
296
-
297
-
298
-
299
-
300
-
301
-
302
-
303
-
304
-
305
-
306
-
307
-
308
-
309
-
310
-
311
 |
 |

2
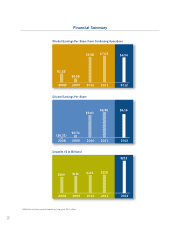
The Tier 1 Common Equity Ratio at the end of 2012 was 10.99% under Basel I capital rules. The equivalent Tier 1
Common Equity Ratio under fully phased-in Basel II/III rules is on track to reach our assumed regulatory minimum
under the new rules in 2013, years before the new requirements take effect.
Capital One’s stock price closed the year at $57.93 per share, up 37% for the year, compared to a 30% increase in
value for the KBW Bank Index. Our Total Shareholder Return (TSR) in 2012 was 37.5%, ahead of the KBW Bank
Index TSR of 30.2%. Since we went public in November of 1994, Capital One’s TSR is approximately 1,134%,
roughly 12 times the 93.1% TSR of the KBW bank index over the same period.
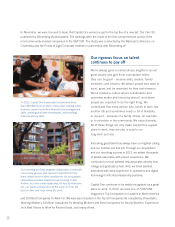
Across our businesses, financial and operating performance was strong
In 2012, Domestic Card delivered $1.4 billion of net income. While below 2011 levels, 2012 net income reflects
$1.3 billion in allowance build for the acquired HSBC U.S. credit card business and $900 million in additional
merger-related impacts on both revenue and operating expense.
Our Domestic Card business is a great business, with consistently high risk-adjusted returns. We were resilient
through the Great Recession and the implementation of the CARD Act. But we face several complex challenges.
The ongoing weakness in consumer demand will constrain loan and revenue growth for some time. Our choice to
invest in franchise enhancements to deliver a great customer experience will lower the “octane” of the business to
some extent but will also help to create valuable long-term customer relationships. And new Basel II/III capital rules
will require us to allocate more capital to the Card business. All of these factors will lower bottom-line return on
equity, but we expect the returns to remain well above hurdle.
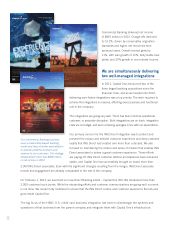
Our Consumer Banking business, which encompasses auto finance, home loans, and our retail and direct banking
businesses, delivered $1.36 billion of net income in 2012, driven by the continuing growth and profitability of our
auto finance business and strong contributions from the direct banking business we acquired from ING.
Capital One Auto Finance solidified and expanded its dealer relationships and posted solid growth and profits in 2012.
New loan originations were about $16.0 billion in 2012, up sharply from $12.5 billion in 2011. Credit losses
remained near historic lows, at about 1.7% for 2012. In 2012, competition increased significantly. Industry margins
decreased modestly and industry loan terms lengthened, particularly for prime borrowers. While we see solid
overall profitability and above-hurdle returns in new originations, we also expect that increased competition will
drive returns from current levels closer to cycle average. As competition increases, we’re keeping a close watch on
industry practices, and if they begin to impact the credit risk of new originations, we’re prepared to pull back to
protect the profitability and resiliency of our auto finance business.
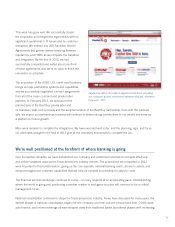
Our retail banking business made improvements across all aspects of banking operations, including our branch
network, infrastructure, products, and sales and service experience. The acquisition and integration of ING Direct
gave us national reach and made Capital One the market leader in direct banking.