Capital One 2012 Annual Report Download - page 211
Download and view the complete annual report
Please find page 211 of the 2012 Capital One annual report below. You can navigate through the pages in the report by either clicking on the pages listed below, or by using the keyword search tool below to find specific information within the annual report.-
 1
1 -
2
-
3
-
4
-
5
-
6
-
7
-
8
-
9
-
10
-
11
-
12
-
13
-
14
-
15
-
16
-
17
-
18
-
19
-
20
-
21
-
22
-
23
-
24
-
25
-
26
-
27
-
28
-
29
-
30
-
31
-
32
-
33
-
34
-
35
-
36
-
37
-
38
-
39
-
40
-
41
-
42
-
43
-
44
-
45
-
46
-
47
-
48
-
49
-
50
-
51
-
52
-
53
-
54
-
55
-
56
-
57
-
58
-
59
-
60
-
61
-
62
-
63
-
64
-
65
-
66
-
67
-
68
-
69
-
70
-
71
-
72
-
73
-
74
-
75
-
76
-
77
-
78
-
79
-
80
-
81
-
82
-
83
-
84
-
85
-
86
-
87
-
88
-
89
-
90
-
91
-
92
-
93
-
94
-
95
-
96
-
97
-
98
-
99
-
100
-
101
-
102
-
103
-
104
-
105
-
106
-
107
-
108
-
109
-
110
-
111
-
112
-
113
-
114
-
115
-
116
-
117
-
118
-
119
-
120
-
121
-
122
-
123
-
124
-
125
-
126
-
127
-
128
-
129
-
130
-
131
-
132
-
133
-
134
-
135
-
136
-
137
-
138
-
139
-
140
-
141
-
142
-
143
-
144
-
145
-
146
-
147
-
148
-
149
-
150
-
151
-
152
-
153
-
154
-
155
-
156
-
157
-
158
-
159
-
160
-
161
-
162
-
163
-
164
-
165
-
166
-
167
-
168
-
169
-
170
-
171
-
172
-
173
-
174
-
175
-
176
-
177
-
178
-
179
-
180
-
181
-
182
-
183
-
184
-
185
-
186
-
187
-
188
-
189
-
190
-
191
-
192
-
193
-
194
-
195
-
196
-
197
-
198
-
199
-
200
-
 201
201 -
 202
202 -
 203
203 -
 204
204 -
 205
205 -
 206
206 -
 207
207 -
 208
208 -
 209
209 -
 210
210 -
 211
211 -
 212
212 -
 213
213 -
 214
214 -
 215
215 -
 216
216 -
 217
217 -
 218
218 -
 219
219 -
 220
220 -
 221
221 -
222
-
223
-
224
-
225
-
226
-
227
-
228
-
229
-
230
-
231
-
232
-
233
-
234
-
235
-
236
-
237
-
238
-
239
-
240
-
241
-
242
-
243
-
244
-
245
-
246
-
247
-
248
-
249
-
250
-
251
-
252
-
253
-
254
-
255
-
256
-
257
-
258
-
259
-
260
-
261
-
262
-
263
-
264
-
265
-
266
-
267
-
268
-
269
-
270
-
271
-
272
-
273
-
274
-
275
-
276
-
277
-
278
-
279
-
280
-
281
-
282
-
283
-
284
-
285
-
286
-
287
-
288
-
289
-
290
-
291
-
292
-
293
-
294
-
295
-
296
-
297
-
298
-
299
-
300
-
301
-
302
-
303
-
304
-
305
-
306
-
307
-
308
-
309
-
310
-
311
 |
 |

CAPITAL ONE FINANCIAL CORPORATION
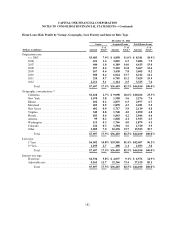
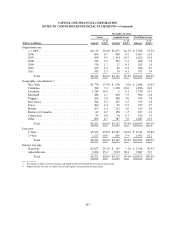
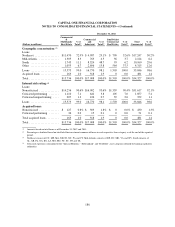
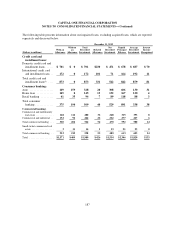
NOTES TO CONSOLIDATED FINANCIAL STATEMENTS—(Continued)
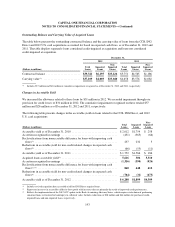
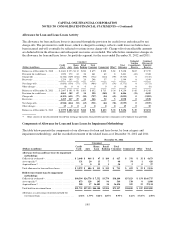
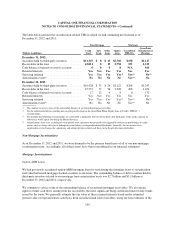
Initial Fair Value and Accretable Yield of Acquired Loans
The table below displays the contractually required cash flows expected to be collected and fair value at
acquisition of acquired ING Direct loans accounted for based on expected cash flows. The table also displays the
nonaccretable difference and the accretable yield at acquisition for these loans.
At Acquisition on February 17, 2012
(Dollars in millions) Total Impaired Loans
Non-
Impaired
Loans
Contractually required principal and interest at acquisition .............. $49,488 $ 3,684 $45,804
Less: Nonaccretable difference .................................... (4,443) (2,343) (2,100)
Cash flows expected to be collected at acquisition(1) (2) ................. 45,045 1,341 43,704
Less: Accretable yield(2) ......................................... (5,483) (173) (5,310)
Fair value of loans acquired(3) (4) ................................... $39,562 $ 1,168 $38,394
(1) Represents undiscounted expected principal and interest cash flows at acquisition.
(2) In the third quarter of 2012 we revised our estimate of contractual cash flows at acquisition which resulted in an adjustment to accretable
yield from $6.6 billion to $5.5 billion.
(3) A portion of the loans acquired in connection with the ING Direct acquisition is accounted for based on the loan’s contractual cash flows
rather than the expected cash flows. These loans, which had an estimated fair value at acquisition of $559 million, are not included in the
above table. The contractual cash flows for these loans at acquisition was $858 million, of which we do not expect to collect $15 million.
(4) A portion of the loans acquired in connection with the ING Direct acquisition was classified as held for sale. These loans, which had an
estimated fair value at acquisition of $367 million, are not included in the above table. The contractual cash flows for these loans at
acquisition was $384 million, of which we do not expect to collect $16 million.
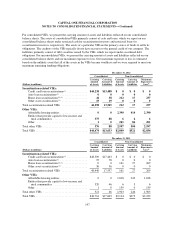
The table below displays the contractually required cash flows expected to be collected and fair value at
acquisition of the 2012 U.S. card acquisition loans accounted for based on expected cash flows. The table also
displays the nonaccretable difference and the accretable yield at acquisition for these loans.
At Acquisition
on May 1, 2012
(Dollars in millions) Impaired Loans
Contractually required principal and interest at acquisition ............................... $1,537
Less: Nonaccretable difference ..................................................... (741)
Cash flows expected to be collected at acquisition(1) .................................... 796
Less: Accretable yield ............................................................ (145)
Fair value of loans acquired(2) (3) .................................................... $ 651
(1) Represents undiscounted expected cash flows of principal and interest, finance charges, and fees at acquisition.
(2) The majority of the loans acquired in connection with the 2012 U.S. card acquisition had revolving privileges at acquisition. As such, we
accounted for these loans based on the contractual cash flows rather than expected cash flows. These loans, which had an estimated fair
value at acquisition of $26.9 billion, are not included in the table above.
(3) A portion of the loans acquired in connection with the 2012 U.S. card acquisition was classified as held for sale. These loans, which had
an estimated fair value of $471 million at acquisition, are not included in the table above.
192