Capital One 2012 Annual Report Download - page 97
Download and view the complete annual report
Please find page 97 of the 2012 Capital One annual report below. You can navigate through the pages in the report by either clicking on the pages listed below, or by using the keyword search tool below to find specific information within the annual report.-
 1
1 -
2
-
3
-
4
-
5
-
6
-
7
-
8
-
9
-
10
-
11
-
12
-
13
-
14
-
15
-
16
-
17
-
18
-
19
-
20
-
21
-
22
-
23
-
24
-
25
-
26
-
27
-
28
-
29
-
30
-
31
-
32
-
33
-
34
-
35
-
36
-
37
-
38
-
39
-
40
-
41
-
42
-
43
-
44
-
45
-
46
-
47
-
48
-
49
-
50
-
51
-
52
-
53
-
54
-
55
-
56
-
57
-
58
-
59
-
60
-
61
-
62
-
63
-
64
-
65
-
66
-
67
-
68
-
69
-
70
-
71
-
72
-
73
-
74
-
75
-
76
-
77
-
78
-
79
-
80
-
81
-
82
-
83
-
84
-
85
-
86
-
 87
87 -
 88
88 -
 89
89 -
 90
90 -
 91
91 -
 92
92 -
 93
93 -
 94
94 -
 95
95 -
 96
96 -
 97
97 -
 98
98 -
 99
99 -
 100
100 -
 101
101 -
 102
102 -
 103
103 -
 104
104 -
 105
105 -
 106
106 -
 107
107 -
108
-
109
-
110
-
111
-
112
-
113
-
114
-
115
-
116
-
117
-
118
-
119
-
120
-
121
-
122
-
123
-
124
-
125
-
126
-
127
-
128
-
129
-
130
-
131
-
132
-
133
-
134
-
135
-
136
-
137
-
138
-
139
-
140
-
141
-
142
-
143
-
144
-
145
-
146
-
147
-
148
-
149
-
150
-
151
-
152
-
153
-
154
-
155
-
156
-
157
-
158
-
159
-
160
-
161
-
162
-
163
-
164
-
165
-
166
-
167
-
168
-
169
-
170
-
171
-
172
-
173
-
174
-
175
-
176
-
177
-
178
-
179
-
180
-
181
-
182
-
183
-
184
-
185
-
186
-
187
-
188
-
189
-
190
-
191
-
192
-
193
-
194
-
195
-
196
-
197
-
198
-
199
-
200
-
201
-
202
-
203
-
204
-
205
-
206
-
207
-
208
-
209
-
210
-
211
-
212
-
213
-
214
-
215
-
216
-
217
-
218
-
219
-
220
-
221
-
222
-
223
-
224
-
225
-
226
-
227
-
228
-
229
-
230
-
231
-
232
-
233
-
234
-
235
-
236
-
237
-
238
-
239
-
240
-
241
-
242
-
243
-
244
-
245
-
246
-
247
-
248
-
249
-
250
-
251
-
252
-
253
-
254
-
255
-
256
-
257
-
258
-
259
-
260
-
261
-
262
-
263
-
264
-
265
-
266
-
267
-
268
-
269
-
270
-
271
-
272
-
273
-
274
-
275
-
276
-
277
-
278
-
279
-
280
-
281
-
282
-
283
-
284
-
285
-
286
-
287
-
288
-
289
-
290
-
291
-
292
-
293
-
294
-
295
-
296
-
297
-
298
-
299
-
300
-
301
-
302
-
303
-
304
-
305
-
306
-
307
-
308
-
309
-
310
-
311
 |
 |

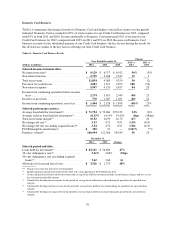
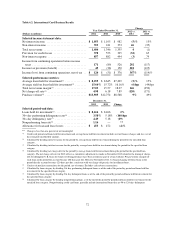
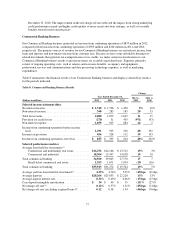
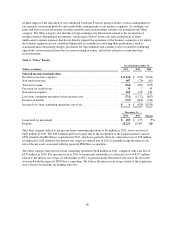
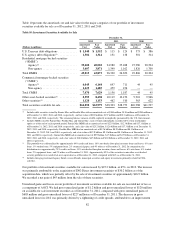
(Dollars in millions)
December 31,
2012 2011 Change
Selected period-end data:
Loans held for investment:(1)
Commercial and multifamily real estate .......... $17,732 $15,736 13%
Commercial and industrial ..................... 19,892 17,088 16
Total commercial lending .......................... 37,624 32,824 15
Small-ticket commercial real estate .............. 1,196 1,503 (20)
Total commercial banking ......................... $38,820 $34,327 13%
Nonperforming loan rate(5) ......................... 0.73% 1.08% (35)bps
Nonperforming loan rate (excluding acquired loans)(4) ... 0.73 1.10 (37)
Nonperforming asset rate(6) ........................ 0.77 1.17 (40)
Nonperforming asset rate (excluding acquired loans)(4) ... 0.78 1.18 (40)
Allowance for loan and lease losses ................. $ 433 $ 715 (39)%
Deposits ....................................... 29,866 26,683 12
** Change is less than one percent or not meaningful.
(1) Loans held for investment includes loans acquired in the ING Direct and Chevy Chase Bank acquisitions. The carrying value of
commercial banking acquired loans accounted for subsequent to acquisition based on expected cash flows to be collected was $359
million and $481 million as of December 31, 2012 and 2011, respectively. The average balance of commercial banking loans held for
investment, excluding the carrying value of acquired loans, was $35.1 billion, $30.8 billion and $29.1 billion in 2012, 2011 and 2010,
respectively.
(2) Calculated by dividing interest income for the period by average loans held for investment during the period for the specified loan
category.
(3) Calculated by dividing net charge-offs for the period by average loans held for investment during the period for the specified loan
category.
(4) Calculation of ratio adjusted to exclude from the denominator acquired loans accounted for subsequent to acquisition based on expected
cash flows to be collected. See “Item 6. Selected Financial Data,” “Credit Risk Profile” and “Note 5—Loans—Credit Quality” for
additional information on the impact of acquired loans on our credit quality metrics.
(5) Calculated by loan category by dividing nonperforming loans as of the end of the period by period-end loans held for investment for the
specified loan category. Nonperforming loans generally include loans that have been placed on nonaccrual status and certain restructured
loans whose contractual terms have been restructured in a manner that grants a concession to a borrower experiencing financial
difficulty.
(6) Calculated by loan category by dividing nonperforming assets as of the end of the period by period-end loans held for investment, REO,
and other foreclosed assets for the specified loan category.
Key factors affecting the results of our Commercial Banking business for 2012, compared with 2011, included
the following:
•Net Interest Income: Net interest income increased by $144 million, or 9%, in 2012. The increase was
primarily driven by higher deposit balances and growth in commercial real estate and commercial and
industrial loans.
•Non-Interest Income: Non-interest income increased by $57 million or 20%, in 2012, largely attributable to
growth in fees from ancillary services provided to customers and a gain of $7 million recorded in the third
quarter of 2012 on the sale of certain real-estate investment projects.
•Provision for Credit Losses: The provision for credit losses was a negative $270 million in 2012, compared
with a provision of credit losses of $31 million in 2011. The negative provision in 2012 reflected a
significant decrease in net charge-offs, resulting in an increase in allowance releases attributable to the
improvement in underlying credit performance trends. We recorded a release of the combined allowance for
loan losses and reserve for unfunding lending commitments of $313 million in 2012, compared with a
release of $156 million in 2011.
78