Capital One 2012 Annual Report Download - page 189
Download and view the complete annual report
Please find page 189 of the 2012 Capital One annual report below. You can navigate through the pages in the report by either clicking on the pages listed below, or by using the keyword search tool below to find specific information within the annual report.-
 1
1 -
2
-
3
-
4
-
5
-
6
-
7
-
8
-
9
-
10
-
11
-
12
-
13
-
14
-
15
-
16
-
17
-
18
-
19
-
20
-
21
-
22
-
23
-
24
-
25
-
26
-
27
-
28
-
29
-
30
-
31
-
32
-
33
-
34
-
35
-
36
-
37
-
38
-
39
-
40
-
41
-
42
-
43
-
44
-
45
-
46
-
47
-
48
-
49
-
50
-
51
-
52
-
53
-
54
-
55
-
56
-
57
-
58
-
59
-
60
-
61
-
62
-
63
-
64
-
65
-
66
-
67
-
68
-
69
-
70
-
71
-
72
-
73
-
74
-
75
-
76
-
77
-
78
-
79
-
80
-
81
-
82
-
83
-
84
-
85
-
86
-
87
-
88
-
89
-
90
-
91
-
92
-
93
-
94
-
95
-
96
-
97
-
98
-
99
-
100
-
101
-
102
-
103
-
104
-
105
-
106
-
107
-
108
-
109
-
110
-
111
-
112
-
113
-
114
-
115
-
116
-
117
-
118
-
119
-
120
-
121
-
122
-
123
-
124
-
125
-
126
-
127
-
128
-
129
-
130
-
131
-
132
-
133
-
134
-
135
-
136
-
137
-
138
-
139
-
140
-
141
-
142
-
143
-
144
-
145
-
146
-
147
-
148
-
149
-
150
-
151
-
152
-
153
-
154
-
155
-
156
-
157
-
158
-
159
-
160
-
161
-
162
-
163
-
164
-
165
-
166
-
167
-
168
-
169
-
170
-
171
-
172
-
173
-
174
-
175
-
176
-
177
-
178
-
 179
179 -
 180
180 -
 181
181 -
 182
182 -
 183
183 -
 184
184 -
 185
185 -
 186
186 -
 187
187 -
 188
188 -
 189
189 -
 190
190 -
 191
191 -
 192
192 -
 193
193 -
 194
194 -
 195
195 -
 196
196 -
 197
197 -
 198
198 -
 199
199 -
200
-
201
-
202
-
203
-
204
-
205
-
206
-
207
-
208
-
209
-
210
-
211
-
212
-
213
-
214
-
215
-
216
-
217
-
218
-
219
-
220
-
221
-
222
-
223
-
224
-
225
-
226
-
227
-
228
-
229
-
230
-
231
-
232
-
233
-
234
-
235
-
236
-
237
-
238
-
239
-
240
-
241
-
242
-
243
-
244
-
245
-
246
-
247
-
248
-
249
-
250
-
251
-
252
-
253
-
254
-
255
-
256
-
257
-
258
-
259
-
260
-
261
-
262
-
263
-
264
-
265
-
266
-
267
-
268
-
269
-
270
-
271
-
272
-
273
-
274
-
275
-
276
-
277
-
278
-
279
-
280
-
281
-
282
-
283
-
284
-
285
-
286
-
287
-
288
-
289
-
290
-
291
-
292
-
293
-
294
-
295
-
296
-
297
-
298
-
299
-
300
-
301
-
302
-
303
-
304
-
305
-
306
-
307
-
308
-
309
-
310
-
311
 |
 |

CAPITAL ONE FINANCIAL CORPORATION
NOTES TO CONSOLIDATED FINANCIAL STATEMENTS—(Continued)
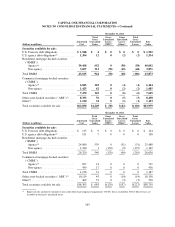
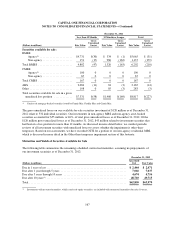
The table below presents activity for the years ended December 31, 2012, 2011 and 2010, related to the credit
component of OTTI recognized in earnings on investment debt securities:
Year Ended December 31,
(Dollars in millions) 2012 2011 2010
Credit loss component, beginning of period ............................. $ 68 $49 $ 32
Additions:
Initial credit impairment ........................................ 22 3 12
Subsequent credit impairment .................................... 30 18 17
Total additions ............................................ 52 21 29
Reductions:
Sales of credit-impaired securities ................................ 0(2) (4)
Change in intent to sell or requirement to sell ....................... 00 (8)
Total reductions ........................................... 0(2) (12)
Ending balance ................................................... $120 $68 $ 49
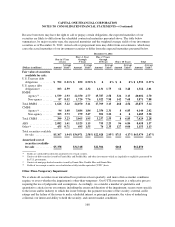
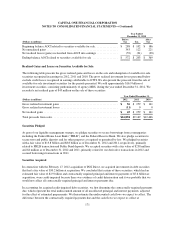
AOCI Related to Securities Available for Sale
The table below presents the changes in AOCI, net of tax, related to our available-for-sale securities. The net
unrealized gains (losses) represent the fair value adjustments recorded on available-for-sale securities, net of tax,
during the period. The net reclassification adjustment for net realized losses (gains) represents the amount of
those fair value adjustments, net of tax, that were recognized in earnings due to the sale of an available-for-sale
security.
Year Ended
December 31, 2012
(Dollars in millions)
Before
Tax Tax
After
Tax
Beginning balance AOCI related to securities available for sale ............. $ 456 $170 $ 286
Net unrealized gains ............................................... 718 273 445
Net realized losses (gains) reclassified from AOCI into earnings ............ (45) (17) (28)
Ending balance AOCI related to securities available for sale ................ $1,129 $426 $ 703
Year Ended
December 31, 2011
(Dollars in millions)
Before
Tax Tax
After
Tax
Beginning balance AOCI related to securities available for sale ............. $ 572 $203 $ 369
Net unrealized gains ............................................... 64 31 33
Net realized losses (gains) reclassified from AOCI into earnings ............ (180) (64) (116)
Ending balance AOCI related to securities available for sale ................ $ 456 $170 $ 286
170