Capital One 2012 Annual Report Download - page 270
Download and view the complete annual report
Please find page 270 of the 2012 Capital One annual report below. You can navigate through the pages in the report by either clicking on the pages listed below, or by using the keyword search tool below to find specific information within the annual report.-
 1
1 -
2
-
3
-
4
-
5
-
6
-
7
-
8
-
9
-
10
-
11
-
12
-
13
-
14
-
15
-
16
-
17
-
18
-
19
-
20
-
21
-
22
-
23
-
24
-
25
-
26
-
27
-
28
-
29
-
30
-
31
-
32
-
33
-
34
-
35
-
36
-
37
-
38
-
39
-
40
-
41
-
42
-
43
-
44
-
45
-
46
-
47
-
48
-
49
-
50
-
51
-
52
-
53
-
54
-
55
-
56
-
57
-
58
-
59
-
60
-
61
-
62
-
63
-
64
-
65
-
66
-
67
-
68
-
69
-
70
-
71
-
72
-
73
-
74
-
75
-
76
-
77
-
78
-
79
-
80
-
81
-
82
-
83
-
84
-
85
-
86
-
87
-
88
-
89
-
90
-
91
-
92
-
93
-
94
-
95
-
96
-
97
-
98
-
99
-
100
-
101
-
102
-
103
-
104
-
105
-
106
-
107
-
108
-
109
-
110
-
111
-
112
-
113
-
114
-
115
-
116
-
117
-
118
-
119
-
120
-
121
-
122
-
123
-
124
-
125
-
126
-
127
-
128
-
129
-
130
-
131
-
132
-
133
-
134
-
135
-
136
-
137
-
138
-
139
-
140
-
141
-
142
-
143
-
144
-
145
-
146
-
147
-
148
-
149
-
150
-
151
-
152
-
153
-
154
-
155
-
156
-
157
-
158
-
159
-
160
-
161
-
162
-
163
-
164
-
165
-
166
-
167
-
168
-
169
-
170
-
171
-
172
-
173
-
174
-
175
-
176
-
177
-
178
-
179
-
180
-
181
-
182
-
183
-
184
-
185
-
186
-
187
-
188
-
189
-
190
-
191
-
192
-
193
-
194
-
195
-
196
-
197
-
198
-
199
-
200
-
201
-
202
-
203
-
204
-
205
-
206
-
207
-
208
-
209
-
210
-
211
-
212
-
213
-
214
-
215
-
216
-
217
-
218
-
219
-
220
-
221
-
222
-
223
-
224
-
225
-
226
-
227
-
228
-
229
-
230
-
231
-
232
-
233
-
234
-
235
-
236
-
237
-
238
-
239
-
240
-
241
-
242
-
243
-
244
-
245
-
246
-
247
-
248
-
249
-
250
-
251
-
252
-
253
-
254
-
255
-
256
-
257
-
258
-
259
-
 260
260 -
 261
261 -
 262
262 -
 263
263 -
 264
264 -
 265
265 -
 266
266 -
 267
267 -
 268
268 -
 269
269 -
 270
270 -
 271
271 -
 272
272 -
 273
273 -
 274
274 -
 275
275 -
 276
276 -
 277
277 -
 278
278 -
 279
279 -
 280
280 -
281
-
282
-
283
-
284
-
285
-
286
-
287
-
288
-
289
-
290
-
291
-
292
-
293
-
294
-
295
-
296
-
297
-
298
-
299
-
300
-
301
-
302
-
303
-
304
-
305
-
306
-
307
-
308
-
309
-
310
-
311
 |
 |

CAPITAL ONE FINANCIAL CORPORATION
NOTES TO CONSOLIDATED FINANCIAL STATEMENTS—(Continued)
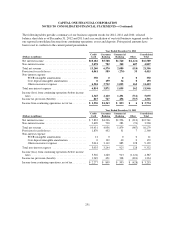
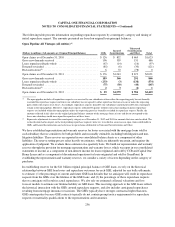
The following tables provide a summary of our business segment results for 2012, 2011 and 2010, selected
balance sheet data as of December 31, 2012 and 2011 and a reconciliation of our total business segment results to
our reported consolidated income from continuing operations, assets and deposits. Prior period amounts have
been recast to conform to the current period presentation.
Year Ended December 31, 2012
(Dollars in millions)
Credit
Card
Consumer
Banking
Commercial
Banking Other
Consolidated
Total
Net interest income ............................... $10,182 $5,788 $1,740 $(1,121) $16,589
Non-interest income .............................. 3,078 782 340 607 4,807
Total net revenue ................................. 13,260 6,570 2,080 (514) 21,396
Provision for credit losses .......................... 4,061 589 (270) 35 4,415
Non-interest expense:
PCCR intangible amortization .................. 350 0 0 0 350
Core deposit intangible amortization ............. 0 159 34 0 193
Other non-interest expense ..................... 6,504 3,712 1,025 162 11,403
Total non-interest expense ......................... 6,854 3,871 1,059 162 11,946
Income (loss) from continuing operations before income
taxes ........................................ 2,345 2,110 1,291 (711) 5,035
Income tax provision (benefit) ...................... 815 747 456 (717) 1,301
Income from continuing operations, net of tax .......... $ 1,530 $1,363 $ 835 $ 6 $ 3,734
Year Ended December 31, 2011
(Dollars in millions)
Credit
Card
Consumer
Banking
Commercial
Banking Other
Consolidated
Total
Net interest income ............................... $ 7,822 $4,236 $1,596 $ (913) $12,741
Non-interest income .............................. 2,609 720 283 (74) 3,538
Total net revenue ................................. 10,431 4,956 1,879 (987) 16,279
Provision for credit losses .......................... 1,870 452 31 7 2,360
Non-interest expense:
PCCR intangible amortization .................. 21 0 0 0 21
Core deposit intangible amortization ............. 0 132 40 0 172
Other non-interest expense ..................... 5,014 3,112 885 128 9,139
Total non-interest expense ......................... 5,035 3,244 925 128 9,332
Income (loss) from continuing operations before income
taxes ........................................ 3,526 1,260 923 (1,122) 4,587
Income tax provision (benefit) ...................... 1,249 451 328 (694) 1,334
Income from continuing operations, net of tax .......... $ 2,277 $ 809 $ 595 $ (428) $ 3,253
251