Capital One 2012 Annual Report Download - page 98
Download and view the complete annual report
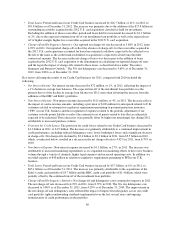
Please find page 98 of the 2012 Capital One annual report below. You can navigate through the pages in the report by either clicking on the pages listed below, or by using the keyword search tool below to find specific information within the annual report.•Non-Interest Expense: Non-interest expense increased by $134 million, or 14%, in 2012. The increase was
due to costs associated with higher originations in our commercial real estate and commercial and industrial
businesses, expansion into new markets and infrastructure investments.
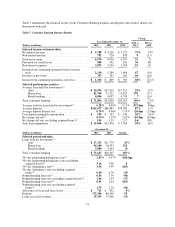
•Total Loans: Period-end loans increased by $4.5 billion, or 13%, in 2012 to $38.8 billion as of
December 31, 2012. The increase was driven by stronger loan originations in the commercial and industrial
and commercial real estate businesses, which was partially offset by the run-off and sale of a portion of the
small-ticket commercial real estate loan portfolio.
•Deposits: Period-end deposits in the Commercial Banking business increased by $3.2 billion, or 12%, in
2012 to $29.9 billion as of December 31, 2012, driven by our strategy to strengthen existing relationships
and increase liquidity from commercial customers.
•Charge-off Statistics: The net charge-off rate decreased to 0.12% in 2012, from 0.57% in 2011. The
nonperforming loan rate decreased to 0.73% as of December 31, 2012, from 1.08% as of December 31,
2011. The significant improvement in the credit metrics in our Commercial Banking business reflected a
continued improvement in credit trends and strengthening of underlying collateral values, resulting in lower
loss severities and opportunities for recoveries on previously charged-off loans.
Key factors affecting the results of our Commercial Banking business for 2011, compared with 2010, included
the following:
•Net Interest Income: Net interest income increased by $146 million, or 10%, in 2011. The increase was
primarily driven by an increase in average loans and deposits and continued improvement in deposit pricing.
•Non-Interest Income: Non-interest income increased by $98 million, or 53%, in 2011. The increase was
largely attributable to growth in fees and the absence of a loss of $18 million recognized in 2010 from the
sale of a legacy portfolio of small-ticket commercial real estate loans.
•Provision for Credit Losses: The provision for credit losses was $31 million in 2011, compared with
$435 million in 2010. The significant reduction in the provision for credit losses in 2011 was attributable to
lower loss severities resulting from improvements in underlying collateral asset values. As a result, we
recorded a release of the combined allowance for loan losses and reserve for unfunding lending
commitments of $156 million in 2011. In comparison, we increased the combined allowance by $48 million
in 2010.
•Non-Interest Expense: Non-interest expense increased by $41 million, or 5%, in 2011, driven by growth in
loan originations and other real-estate investments.
•Total Loans: Period-end loans increased by $4.4 billion, or 15%, in 2011 to $34.3 billion as of
December 31, 2011. The increase was driven by stronger loan originations in the commercial real estate and
industrial businesses, which was partially offset by the run-off and sale of a portion of the small-ticket
commercial real estate loan portfolio.
•Deposits: Period-end deposits in the Commercial Banking business increased by $4.0 billion, or 18%, in
2011 to $26.7 billion as of December 31, 2011, driven by our strategy to strengthen existing relationships
and increase liquidity from commercial customers.
•Charge-off and Nonperforming Loan Statistics: The net charge-off rate decreased to 0.57% in 2011, from
1.31% in 2010. The nonperforming loan rate decreased to 1.08% as of December 31, 2011, from 1.65% as
of December 31, 2010. The improvement in the net charge-off and nonperforming loan rates was
attributable to slowly improving underlying credit trends and improvements in underlying collateral asset
values.
“Other” Category
Net income from continuing operations recorded in Other was $6 million in 2012, compared with a net loss from
continuing operations of $428 million and $333 million in 2011 and 2010, respectively. Other includes the
79


