Capital One 2012 Annual Report Download - page 302
Download and view the complete annual report
Please find page 302 of the 2012 Capital One annual report below. You can navigate through the pages in the report by either clicking on the pages listed below, or by using the keyword search tool below to find specific information within the annual report.-
 1
1 -
2
-
3
-
4
-
5
-
6
-
7
-
8
-
9
-
10
-
11
-
12
-
13
-
14
-
15
-
16
-
17
-
18
-
19
-
20
-
21
-
22
-
23
-
24
-
25
-
26
-
27
-
28
-
29
-
30
-
31
-
32
-
33
-
34
-
35
-
36
-
37
-
38
-
39
-
40
-
41
-
42
-
43
-
44
-
45
-
46
-
47
-
48
-
49
-
50
-
51
-
52
-
53
-
54
-
55
-
56
-
57
-
58
-
59
-
60
-
61
-
62
-
63
-
64
-
65
-
66
-
67
-
68
-
69
-
70
-
71
-
72
-
73
-
74
-
75
-
76
-
77
-
78
-
79
-
80
-
81
-
82
-
83
-
84
-
85
-
86
-
87
-
88
-
89
-
90
-
91
-
92
-
93
-
94
-
95
-
96
-
97
-
98
-
99
-
100
-
101
-
102
-
103
-
104
-
105
-
106
-
107
-
108
-
109
-
110
-
111
-
112
-
113
-
114
-
115
-
116
-
117
-
118
-
119
-
120
-
121
-
122
-
123
-
124
-
125
-
126
-
127
-
128
-
129
-
130
-
131
-
132
-
133
-
134
-
135
-
136
-
137
-
138
-
139
-
140
-
141
-
142
-
143
-
144
-
145
-
146
-
147
-
148
-
149
-
150
-
151
-
152
-
153
-
154
-
155
-
156
-
157
-
158
-
159
-
160
-
161
-
162
-
163
-
164
-
165
-
166
-
167
-
168
-
169
-
170
-
171
-
172
-
173
-
174
-
175
-
176
-
177
-
178
-
179
-
180
-
181
-
182
-
183
-
184
-
185
-
186
-
187
-
188
-
189
-
190
-
191
-
192
-
193
-
194
-
195
-
196
-
197
-
198
-
199
-
200
-
201
-
202
-
203
-
204
-
205
-
206
-
207
-
208
-
209
-
210
-
211
-
212
-
213
-
214
-
215
-
216
-
217
-
218
-
219
-
220
-
221
-
222
-
223
-
224
-
225
-
226
-
227
-
228
-
229
-
230
-
231
-
232
-
233
-
234
-
235
-
236
-
237
-
238
-
239
-
240
-
241
-
242
-
243
-
244
-
245
-
246
-
247
-
248
-
249
-
250
-
251
-
252
-
253
-
254
-
255
-
256
-
257
-
258
-
259
-
260
-
261
-
262
-
263
-
264
-
265
-
266
-
267
-
268
-
269
-
270
-
271
-
272
-
273
-
274
-
275
-
276
-
277
-
278
-
279
-
280
-
281
-
282
-
283
-
284
-
285
-
286
-
287
-
288
-
289
-
290
-
291
-
 292
292 -
 293
293 -
 294
294 -
 295
295 -
 296
296 -
 297
297 -
 298
298 -
 299
299 -
 300
300 -
 301
301 -
 302
302 -
 303
303 -
 304
304 -
 305
305 -
 306
306 -
 307
307 -
 308
308 -
 309
309 -
 310
310 -
 311
311
 |
 |

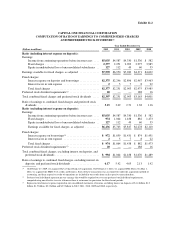
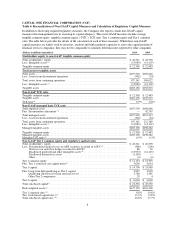
Exhibit 12.2
CAPITAL ONE FINANCIAL CORPORATION
COMPUTATION OF RATIO OF EARNINGS TO COMBINED FIXED CHARGES
AND PREFERRED STOCK DIVIDENDS(1)
Year Ended December 31,
(Dollars in millions) 2012 2011 2010 2009 2008
Ratio (including interest expense on deposits):
Earnings:
Income from continuing operations before income taxes .... $5,035 $4,587 $4,330 $1,336 $ 582
Fixed charges ...................................... 2,377 2,251 2,903 2,975 3,985
Equity in undistributed loss of unconsolidated subsidiaries . . 127 112 49 60 55
Earnings available for fixed charges, as adjusted .............. $7,539 $6,950 $7,282 $4,371 $4,622
Fixed charges:
Interest expense on deposits and borrowings .............. $2,375 $2,246 $2,896 $2,967 $3,963
Interest factor in rent expense ......................... 257822
Total fixed charges .................................. $2,377 $2,251 $2,903 $2,975 $3,985
Preferred stock dividend requirements(2) ..................... 20 — — 188 16
Total combined fixed charges and preferred stock dividends ..... $2,397 $2,251 $2,903 $3,163 $4,001
Ratio of earnings to combined fixed charges and preferred stock
dividends ........................................... 3.15 3.09 2.51 1.38 1.16
Ratio (excluding interest expense on deposits):
Earnings:
Income from continuing operations before income taxes .... $5,035 $4,587 $4,330 $1,336 $ 582
Fixed charges ...................................... 974 1,064 1,438 882 1,473
Equity in undistributed loss of unconsolidated subsidiaries . . 127 112 49 60 55
Earnings available for fixed charges, as adjusted .......... $6,136 $5,763 $5,817 $2,278 $2,110
Fixed charges:
Interest expense on borrowings(3) ....................... $ 972 $1,059 $1,431 $ 874 $1,451
Interest factor in rent expense ......................... 257822
Total fixed charges .................................. $ 974 $1,064 $1,438 $ 882 $1,473
Preferred stock dividend requirements(2) ..................... 20 — — 188 16
Total combined fixed charges, excluding interest on deposits, and
preferred stock dividends ............................... $ 994 $1,064 $1,438 $1,070 $1,489
Ratio of earnings to combined fixed charges, excluding interest on
deposits, and preferred stock dividends .................... 6.17 5.42 4.05 2.13 1.42
(1) On February 27, 2009, we acquired Chevy Chase Bank, fsb acquisition. On February 17, 2012, we acquired ING Direct. On May 1,
2012, we acquired the HSBC U.S. credit card business. Each of these transactions was accounted for under the acquisition method of
accounting, and their respective results of operations are included in our results from each respective transaction date.
(2) Preferred stock dividends represent pre-tax earnings that would be required to cover any preferred stock dividend requirements,
computed using our effective tax rate, whenever there is an income tax provision, for the relevant periods.
(3) Represents total interest expense reported in our consolidated statements of income, excluding interest on deposits of $1.4 billion, $1.2
billion, $1.5 billion, $2.1 billion and $2.5 billion in 2012, 2011, 2010, 2009 and 2008, respectively.