Capital One 2012 Annual Report Download - page 194
Download and view the complete annual report
Please find page 194 of the 2012 Capital One annual report below. You can navigate through the pages in the report by either clicking on the pages listed below, or by using the keyword search tool below to find specific information within the annual report.-
 1
1 -
2
-
3
-
4
-
5
-
6
-
7
-
8
-
9
-
10
-
11
-
12
-
13
-
14
-
15
-
16
-
17
-
18
-
19
-
20
-
21
-
22
-
23
-
24
-
25
-
26
-
27
-
28
-
29
-
30
-
31
-
32
-
33
-
34
-
35
-
36
-
37
-
38
-
39
-
40
-
41
-
42
-
43
-
44
-
45
-
46
-
47
-
48
-
49
-
50
-
51
-
52
-
53
-
54
-
55
-
56
-
57
-
58
-
59
-
60
-
61
-
62
-
63
-
64
-
65
-
66
-
67
-
68
-
69
-
70
-
71
-
72
-
73
-
74
-
75
-
76
-
77
-
78
-
79
-
80
-
81
-
82
-
83
-
84
-
85
-
86
-
87
-
88
-
89
-
90
-
91
-
92
-
93
-
94
-
95
-
96
-
97
-
98
-
99
-
100
-
101
-
102
-
103
-
104
-
105
-
106
-
107
-
108
-
109
-
110
-
111
-
112
-
113
-
114
-
115
-
116
-
117
-
118
-
119
-
120
-
121
-
122
-
123
-
124
-
125
-
126
-
127
-
128
-
129
-
130
-
131
-
132
-
133
-
134
-
135
-
136
-
137
-
138
-
139
-
140
-
141
-
142
-
143
-
144
-
145
-
146
-
147
-
148
-
149
-
150
-
151
-
152
-
153
-
154
-
155
-
156
-
157
-
158
-
159
-
160
-
161
-
162
-
163
-
164
-
165
-
166
-
167
-
168
-
169
-
170
-
171
-
172
-
173
-
174
-
175
-
176
-
177
-
178
-
179
-
180
-
181
-
182
-
183
-
 184
184 -
 185
185 -
 186
186 -
 187
187 -
 188
188 -
 189
189 -
 190
190 -
 191
191 -
 192
192 -
 193
193 -
 194
194 -
 195
195 -
 196
196 -
 197
197 -
 198
198 -
 199
199 -
 200
200 -
 201
201 -
 202
202 -
 203
203 -
 204
204 -
205
-
206
-
207
-
208
-
209
-
210
-
211
-
212
-
213
-
214
-
215
-
216
-
217
-
218
-
219
-
220
-
221
-
222
-
223
-
224
-
225
-
226
-
227
-
228
-
229
-
230
-
231
-
232
-
233
-
234
-
235
-
236
-
237
-
238
-
239
-
240
-
241
-
242
-
243
-
244
-
245
-
246
-
247
-
248
-
249
-
250
-
251
-
252
-
253
-
254
-
255
-
256
-
257
-
258
-
259
-
260
-
261
-
262
-
263
-
264
-
265
-
266
-
267
-
268
-
269
-
270
-
271
-
272
-
273
-
274
-
275
-
276
-
277
-
278
-
279
-
280
-
281
-
282
-
283
-
284
-
285
-
286
-
287
-
288
-
289
-
290
-
291
-
292
-
293
-
294
-
295
-
296
-
297
-
298
-
299
-
300
-
301
-
302
-
303
-
304
-
305
-
306
-
307
-
308
-
309
-
310
-
311
 |
 |

CAPITAL ONE FINANCIAL CORPORATION
NOTES TO CONSOLIDATED FINANCIAL STATEMENTS—(Continued)
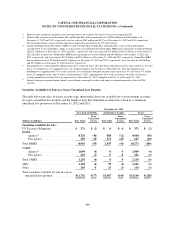
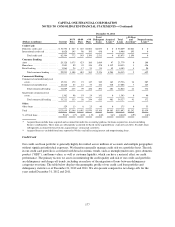
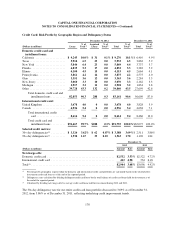
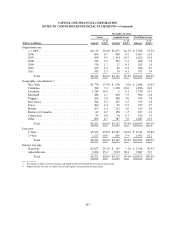
The table below presents the composition of our held-for-investment loan portfolio, including restricted loans for
securitization investors, as of December 31, 2012 and 2011.
December 31,
(Dollars in millions) 2012 2011
Credit Card business:
Domestic credit card loans .................................................. $ 82,328 $ 54,682
International credit card loans ................................................ 8,614 8,466
Total credit card loans .................................................. 90,942 63,148
Domestic installment loans .................................................. 813 1,927
Total credit card ...................................................... 91,755 65,075
Consumer Banking business:
Auto .................................................................... 27,123 21,779
Home loan ............................................................... 44,100 10,433
Other retail ............................................................... 3,904 4,103
Total consumer banking ................................................ 75,127 36,315
Commercial Banking business:(1)
Commercial and multifamily real estate ........................................ 17,732 15,736
Commercial and industrial .................................................. 19,892 17,088
Total commercial lending ............................................... 37,624 32,824
Small-ticket commercial real estate ........................................... 1,196 1,503
Total commercial banking ............................................... 38,820 34,327
Other:
Other loans .............................................................. 187 175
Total loans ............................................................... $205,889 $135,892
(1) Includes construction loans and land development loans totaling $2.1 billion and $2.2 billion as of December 31, 2012 and 2011,
respectively.
The significant increase in loans held for investment was attributable to the addition of $40.4 billion of loans
from the ING Direct acquisition and $27.8 billion of loans classified as held for investment from the 2012 U.S.
card acquisition, which was partially offset by the continued expected run-off of loans in businesses we exited or
repositioned, other loan pay downs and charge-offs.
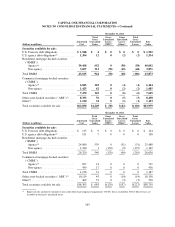
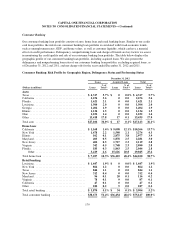
Credit Quality
We closely monitor economic conditions and loan performance trends to manage and evaluate our exposure to
credit risk. Trends in delinquency ratios are an indicator, among other considerations, of credit risk within our
loan portfolios. The level of nonperforming assets represents another indicator of the potential for future credit
losses. Accordingly, key metrics we track and use in evaluating the credit quality of our loan portfolio include
delinquency and nonperforming asset rates, as well as charge-off rates and our internal risk ratings of larger
balance, commercial loans.
175