Capital One 2012 Annual Report Download - page 102
Download and view the complete annual report
Please find page 102 of the 2012 Capital One annual report below. You can navigate through the pages in the report by either clicking on the pages listed below, or by using the keyword search tool below to find specific information within the annual report.-
 1
1 -
2
-
3
-
4
-
5
-
6
-
7
-
8
-
9
-
10
-
11
-
12
-
13
-
14
-
15
-
16
-
17
-
18
-
19
-
20
-
21
-
22
-
23
-
24
-
25
-
26
-
27
-
28
-
29
-
30
-
31
-
32
-
33
-
34
-
35
-
36
-
37
-
38
-
39
-
40
-
41
-
42
-
43
-
44
-
45
-
46
-
47
-
48
-
49
-
50
-
51
-
52
-
53
-
54
-
55
-
56
-
57
-
58
-
59
-
60
-
61
-
62
-
63
-
64
-
65
-
66
-
67
-
68
-
69
-
70
-
71
-
72
-
73
-
74
-
75
-
76
-
77
-
78
-
79
-
80
-
81
-
82
-
83
-
84
-
85
-
86
-
87
-
88
-
89
-
90
-
91
-
 92
92 -
 93
93 -
 94
94 -
 95
95 -
 96
96 -
 97
97 -
 98
98 -
 99
99 -
 100
100 -
 101
101 -
 102
102 -
 103
103 -
 104
104 -
 105
105 -
 106
106 -
 107
107 -
 108
108 -
 109
109 -
 110
110 -
 111
111 -
 112
112 -
113
-
114
-
115
-
116
-
117
-
118
-
119
-
120
-
121
-
122
-
123
-
124
-
125
-
126
-
127
-
128
-
129
-
130
-
131
-
132
-
133
-
134
-
135
-
136
-
137
-
138
-
139
-
140
-
141
-
142
-
143
-
144
-
145
-
146
-
147
-
148
-
149
-
150
-
151
-
152
-
153
-
154
-
155
-
156
-
157
-
158
-
159
-
160
-
161
-
162
-
163
-
164
-
165
-
166
-
167
-
168
-
169
-
170
-
171
-
172
-
173
-
174
-
175
-
176
-
177
-
178
-
179
-
180
-
181
-
182
-
183
-
184
-
185
-
186
-
187
-
188
-
189
-
190
-
191
-
192
-
193
-
194
-
195
-
196
-
197
-
198
-
199
-
200
-
201
-
202
-
203
-
204
-
205
-
206
-
207
-
208
-
209
-
210
-
211
-
212
-
213
-
214
-
215
-
216
-
217
-
218
-
219
-
220
-
221
-
222
-
223
-
224
-
225
-
226
-
227
-
228
-
229
-
230
-
231
-
232
-
233
-
234
-
235
-
236
-
237
-
238
-
239
-
240
-
241
-
242
-
243
-
244
-
245
-
246
-
247
-
248
-
249
-
250
-
251
-
252
-
253
-
254
-
255
-
256
-
257
-
258
-
259
-
260
-
261
-
262
-
263
-
264
-
265
-
266
-
267
-
268
-
269
-
270
-
271
-
272
-
273
-
274
-
275
-
276
-
277
-
278
-
279
-
280
-
281
-
282
-
283
-
284
-
285
-
286
-
287
-
288
-
289
-
290
-
291
-
292
-
293
-
294
-
295
-
296
-
297
-
298
-
299
-
300
-
301
-
302
-
303
-
304
-
305
-
306
-
307
-
308
-
309
-
310
-
311
 |
 |

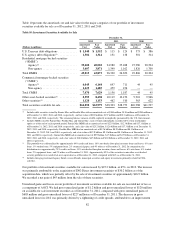
in credit performance and increased liquidity, and continued lower interest rates. Of the $120 million in gross
unrealized losses as of December 31, 2012, $43 million related to securities that had been in a loss position for
more than 12 months.
We provide information on OTTI losses recognized in earnings on our investment securities above under
“Consolidated Results of Operations—Non-Interest Income.”
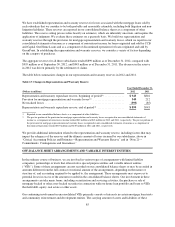
Credit Ratings
Our portfolio of investment securities available for sale continues to be concentrated in securities that generally
have lower credit risk and high credit ratings, such as securities issued and guaranteed by the U.S. Treasury and
other government sponsored enterprises or agencies. Approximately 91% of our total investment securities
portfolio was rated AA+ or its equivalent, or higher, as of both December 31, 2012 and 2011. Approximately 6%
and 4% were below investment grade as of December 31, 2012 and 2011, respectively. We categorize the credit
ratings of our investment securities based on the lowest credit rating as issued by the rating agencies Standard &
Poor’s Ratings Services (“S&P”), Moody’s Investors Service (“Moody’s”) and Fitch Ratings (“Fitch”).
Table 11 provides information on the credit ratings of our non-agency RMBS, non-agency CMBS, other asset-
backed securities and other securities as of December 31, 2012 and 2011.
Table 11: Non-Agency Investment Securities Credit Ratings
December 31,
2012 2011
(Dollars in millions)
Amortized
Cost AAA
Other
Investment
Grade
Below
Investment
Grade or Not
Rated
Amortized
Cost AAA
Other
Investment
Grade
Below
Investment
Grade or Not
Rated
Non-agency RMBS . . . $3,607 —% 5% 95% $ 1,340 —% 3% 97%
Non-agency CMBS . . . 1,425 97 3 — 459 92 8 —
Other asset-backed
securities ......... 8,393 82 17 1 10,119 86 14 —
Other .............. 1,120 67 24 9 462 4 45 51
For additional information on our investment securities, see “Note 4—Investment Securities.”
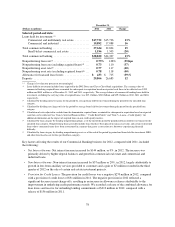
Loans Held for Investment
Table 12 summarizes loans held for investment by business segment, net of the allowance for loan and lease
losses, as of December 31, 2012 and 2011.
Table 12: Net Loans Held for Investment
December 31,
2012 2011
(Dollars in millions)
Total
Loans Held for
Investment Allowance
Net
Loans Held for
Investment
Total
Loans Held for
Investment Allowance
Net
Loans Held for
Investment
Credit card .............. $ 91,755 $3,979 $ 87,776 $ 65,075 $2,847 $ 62,228
Consumer banking ........ 75,127 711 74,416 36,315 652 35,663
Commercial banking ...... 38,820 433 38,387 34,327 715 33,612
Other ................... 187 33 154 175 36 139
Total ............... $205,889 $5,156 $200,733 $135,892 $4,250 $131,642
83