Capital One 2012 Annual Report Download - page 100
Download and view the complete annual report
Please find page 100 of the 2012 Capital One annual report below. You can navigate through the pages in the report by either clicking on the pages listed below, or by using the keyword search tool below to find specific information within the annual report.-
 1
1 -
2
-
3
-
4
-
5
-
6
-
7
-
8
-
9
-
10
-
11
-
12
-
13
-
14
-
15
-
16
-
17
-
18
-
19
-
20
-
21
-
22
-
23
-
24
-
25
-
26
-
27
-
28
-
29
-
30
-
31
-
32
-
33
-
34
-
35
-
36
-
37
-
38
-
39
-
40
-
41
-
42
-
43
-
44
-
45
-
46
-
47
-
48
-
49
-
50
-
51
-
52
-
53
-
54
-
55
-
56
-
57
-
58
-
59
-
60
-
61
-
62
-
63
-
64
-
65
-
66
-
67
-
68
-
69
-
70
-
71
-
72
-
73
-
74
-
75
-
76
-
77
-
78
-
79
-
80
-
81
-
82
-
83
-
84
-
85
-
86
-
87
-
88
-
89
-
 90
90 -
 91
91 -
 92
92 -
 93
93 -
 94
94 -
 95
95 -
 96
96 -
 97
97 -
 98
98 -
 99
99 -
 100
100 -
 101
101 -
 102
102 -
 103
103 -
 104
104 -
 105
105 -
 106
106 -
 107
107 -
 108
108 -
 109
109 -
 110
110 -
111
-
112
-
113
-
114
-
115
-
116
-
117
-
118
-
119
-
120
-
121
-
122
-
123
-
124
-
125
-
126
-
127
-
128
-
129
-
130
-
131
-
132
-
133
-
134
-
135
-
136
-
137
-
138
-
139
-
140
-
141
-
142
-
143
-
144
-
145
-
146
-
147
-
148
-
149
-
150
-
151
-
152
-
153
-
154
-
155
-
156
-
157
-
158
-
159
-
160
-
161
-
162
-
163
-
164
-
165
-
166
-
167
-
168
-
169
-
170
-
171
-
172
-
173
-
174
-
175
-
176
-
177
-
178
-
179
-
180
-
181
-
182
-
183
-
184
-
185
-
186
-
187
-
188
-
189
-
190
-
191
-
192
-
193
-
194
-
195
-
196
-
197
-
198
-
199
-
200
-
201
-
202
-
203
-
204
-
205
-
206
-
207
-
208
-
209
-
210
-
211
-
212
-
213
-
214
-
215
-
216
-
217
-
218
-
219
-
220
-
221
-
222
-
223
-
224
-
225
-
226
-
227
-
228
-
229
-
230
-
231
-
232
-
233
-
234
-
235
-
236
-
237
-
238
-
239
-
240
-
241
-
242
-
243
-
244
-
245
-
246
-
247
-
248
-
249
-
250
-
251
-
252
-
253
-
254
-
255
-
256
-
257
-
258
-
259
-
260
-
261
-
262
-
263
-
264
-
265
-
266
-
267
-
268
-
269
-
270
-
271
-
272
-
273
-
274
-
275
-
276
-
277
-
278
-
279
-
280
-
281
-
282
-
283
-
284
-
285
-
286
-
287
-
288
-
289
-
290
-
291
-
292
-
293
-
294
-
295
-
296
-
297
-
298
-
299
-
300
-
301
-
302
-
303
-
304
-
305
-
306
-
307
-
308
-
309
-
310
-
311
 |
 |

CONSOLIDATED BALANCE SHEET ANALYSIS
Total assets of $312.9 billion as of December 31, 2012 increased by $106.9 billion, or 52%, from $206.0 billion
as of December 31, 2011. Total liabilities of $272.4 billion as of December 31, 2012, increased by $96.1 billion,
or 54%, from $176.4 billion as of December 31, 2011. The increase in total assets and total liabilities was largely
attributable to the assets acquired and liabilities assumed in the ING Direct and 2012 U.S. card acquisitions
previously discussed. Stockholders’ equity increased by $10.8 in 2012, to $40.5 billion as of December 31, 2012.
The increase in stockholders’ equity was attributable to our net income of $3.5 billion in 2012, and $6.8 billion of
capital raised from equity issuances in 2012. For information about our capital requirements, see “Capital
Management” below.
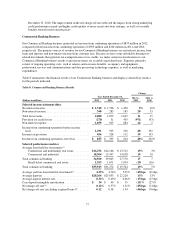
Following is a discussion of material changes in the major components of our assets and liabilities in 2012.
Period-end balance sheet amounts may vary from average balance sheet amounts due to liquidity and balance
sheet management activities that are intended to ensure the adequacy of capital while managing our ability to
manage liquidity requirements for the company and our customers and our market risk exposure in accordance
with our risk appetite.
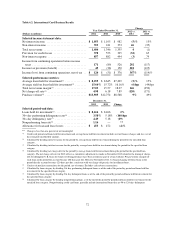
Investment Securities
Substantially all of our investment securities were classified as available for sale as of December 31, 2012, and
all of our investment securities were classified as available for sale as of December 31, 2011. Investment
Securities classified as available for sale are reported in our consolidated balance sheets at fair value. Our
portfolio of investment securities available for sale, which had a fair value of $64.0 billion and $38.8 billion, as
of December 31, 2012 and 2011, respectively, consisted primarily of the following: U.S. Treasury and U.S.
agency debt obligations; agency and non-agency mortgage-backed securities (“MBS”); other asset-backed
securities, and other investments. Based on fair value, investments in U.S. Treasury, agency securities and other
securities explicitly or implicitly guaranteed by the U.S. Government represented 77% of our total investment
securities available for sale as of December 31, 2012, compared with 69% as of December 31, 2011.
We also had $9 million of investment securities as of December 31, 2012, which we purchased in 2012 and
classified as held to maturity. These securities are included in other assets in our consolidated balance sheets.
81