Capital One 2012 Annual Report Download - page 254
Download and view the complete annual report
Please find page 254 of the 2012 Capital One annual report below. You can navigate through the pages in the report by either clicking on the pages listed below, or by using the keyword search tool below to find specific information within the annual report.-
 1
1 -
2
-
3
-
4
-
5
-
6
-
7
-
8
-
9
-
10
-
11
-
12
-
13
-
14
-
15
-
16
-
17
-
18
-
19
-
20
-
21
-
22
-
23
-
24
-
25
-
26
-
27
-
28
-
29
-
30
-
31
-
32
-
33
-
34
-
35
-
36
-
37
-
38
-
39
-
40
-
41
-
42
-
43
-
44
-
45
-
46
-
47
-
48
-
49
-
50
-
51
-
52
-
53
-
54
-
55
-
56
-
57
-
58
-
59
-
60
-
61
-
62
-
63
-
64
-
65
-
66
-
67
-
68
-
69
-
70
-
71
-
72
-
73
-
74
-
75
-
76
-
77
-
78
-
79
-
80
-
81
-
82
-
83
-
84
-
85
-
86
-
87
-
88
-
89
-
90
-
91
-
92
-
93
-
94
-
95
-
96
-
97
-
98
-
99
-
100
-
101
-
102
-
103
-
104
-
105
-
106
-
107
-
108
-
109
-
110
-
111
-
112
-
113
-
114
-
115
-
116
-
117
-
118
-
119
-
120
-
121
-
122
-
123
-
124
-
125
-
126
-
127
-
128
-
129
-
130
-
131
-
132
-
133
-
134
-
135
-
136
-
137
-
138
-
139
-
140
-
141
-
142
-
143
-
144
-
145
-
146
-
147
-
148
-
149
-
150
-
151
-
152
-
153
-
154
-
155
-
156
-
157
-
158
-
159
-
160
-
161
-
162
-
163
-
164
-
165
-
166
-
167
-
168
-
169
-
170
-
171
-
172
-
173
-
174
-
175
-
176
-
177
-
178
-
179
-
180
-
181
-
182
-
183
-
184
-
185
-
186
-
187
-
188
-
189
-
190
-
191
-
192
-
193
-
194
-
195
-
196
-
197
-
198
-
199
-
200
-
201
-
202
-
203
-
204
-
205
-
206
-
207
-
208
-
209
-
210
-
211
-
212
-
213
-
214
-
215
-
216
-
217
-
218
-
219
-
220
-
221
-
222
-
223
-
224
-
225
-
226
-
227
-
228
-
229
-
230
-
231
-
232
-
233
-
234
-
235
-
236
-
237
-
238
-
239
-
240
-
241
-
242
-
243
-
 244
244 -
 245
245 -
 246
246 -
 247
247 -
 248
248 -
 249
249 -
 250
250 -
 251
251 -
 252
252 -
 253
253 -
 254
254 -
 255
255 -
 256
256 -
 257
257 -
 258
258 -
 259
259 -
 260
260 -
 261
261 -
 262
262 -
 263
263 -
 264
264 -
265
-
266
-
267
-
268
-
269
-
270
-
271
-
272
-
273
-
274
-
275
-
276
-
277
-
278
-
279
-
280
-
281
-
282
-
283
-
284
-
285
-
286
-
287
-
288
-
289
-
290
-
291
-
292
-
293
-
294
-
295
-
296
-
297
-
298
-
299
-
300
-
301
-
302
-
303
-
304
-
305
-
306
-
307
-
308
-
309
-
310
-
311
 |
 |

CAPITAL ONE FINANCIAL CORPORATION
NOTES TO CONSOLIDATED FINANCIAL STATEMENTS—(Continued)
withholding tax on these unremitted earnings is not practicable at this time because such liability is dependent
upon circumstances existing if and when remittance occurs.
As of December 31, 2012, U.S. income taxes have not been provided for approximately $287 million of
previously acquired thrift bad debt reserves created for tax purposes as of December 31, 1987. These amounts,
acquired as a result of the merger with North Fork Bancorporation, Inc. and the acquisition of Chevy Chase
Bank, F.S.B., are subject to recapture in the unlikely event that CONA, as successor to North Fork Bank and
Chevy Chase Bank F.S.B., makes distributions in excess of earnings and profits, redeems its stock, or liquidates.
NOTE 19—FAIR VALUE OF FINANCIAL INSTRUMENTS
Fair value is defined as the price that would be received for an asset or paid to transfer a liability in an orderly
transaction between market participants on the measurement date (also referred to as an exit price). The fair value
accounting guidance provides a three-level fair value hierarchy for classifying financial instruments. This
hierarchy is based on whether the inputs to the valuation techniques used to measure fair value are observable or
unobservable. Fair value measurement of a financial asset or liability is assigned to a level based on the lowest
level of any input that is significant to the fair value measurement in its entirety. The three levels of the fair value
hierarchy are described below:
Level 1: Quoted prices (unadjusted) in active markets for identical assets or liabilities
Level 2: Observable market-based inputs, other than quoted prices in active markets for identical assets or
liabilities
Level 3: Unobservable inputs
The accounting guidance for fair value measurements requires that we maximize the use of observable inputs and
minimize the use of unobservable inputs in determining fair value. The accounting guidance provides for the
irrevocable option to elect, on a contract-by-contract basis, to measure certain financial assets and liabilities at
fair value at inception of the contract and record any subsequent changes in fair value into earnings. We have not
made any material fair value option elections as of and for the years ended December 31, 2012 and 2011.
Level 1, 2 and 3 Valuation Techniques
Financial instruments are considered Level 1 when the valuation is based on quoted prices in active markets for
identical assets or liabilities. Level 2 financial instruments are valued using quoted prices for similar assets or
liabilities, quoted prices in markets that are not active, or models using inputs that are observable or can be
corroborated by observable market data of substantially the full term of the assets or liabilities. Financial
instruments are considered Level 3 when their values are determined using pricing models, discounted cash flow
methodologies or similar techniques and at least one significant model assumption or input is unobservable and
when the determination of the fair value requires significant management judgment or estimation.
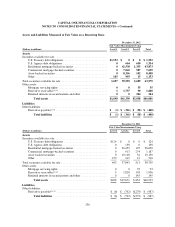
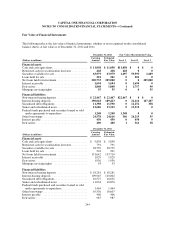
The following table displays our assets and liabilities measured on our consolidated balance sheets at fair value
on a recurring basis as of December 31, 2012 and 2011:
235