Capital One 2012 Annual Report Download - page 124
Download and view the complete annual report
Please find page 124 of the 2012 Capital One annual report below. You can navigate through the pages in the report by either clicking on the pages listed below, or by using the keyword search tool below to find specific information within the annual report.-
 1
1 -
2
-
3
-
4
-
5
-
6
-
7
-
8
-
9
-
10
-
11
-
12
-
13
-
14
-
15
-
16
-
17
-
18
-
19
-
20
-
21
-
22
-
23
-
24
-
25
-
26
-
27
-
28
-
29
-
30
-
31
-
32
-
33
-
34
-
35
-
36
-
37
-
38
-
39
-
40
-
41
-
42
-
43
-
44
-
45
-
46
-
47
-
48
-
49
-
50
-
51
-
52
-
53
-
54
-
55
-
56
-
57
-
58
-
59
-
60
-
61
-
62
-
63
-
64
-
65
-
66
-
67
-
68
-
69
-
70
-
71
-
72
-
73
-
74
-
75
-
76
-
77
-
78
-
79
-
80
-
81
-
82
-
83
-
84
-
85
-
86
-
87
-
88
-
89
-
90
-
91
-
92
-
93
-
94
-
95
-
96
-
97
-
98
-
99
-
100
-
101
-
102
-
103
-
104
-
105
-
106
-
107
-
108
-
109
-
110
-
111
-
112
-
113
-
 114
114 -
 115
115 -
 116
116 -
 117
117 -
 118
118 -
 119
119 -
 120
120 -
 121
121 -
 122
122 -
 123
123 -
 124
124 -
 125
125 -
 126
126 -
 127
127 -
 128
128 -
 129
129 -
 130
130 -
 131
131 -
 132
132 -
 133
133 -
 134
134 -
135
-
136
-
137
-
138
-
139
-
140
-
141
-
142
-
143
-
144
-
145
-
146
-
147
-
148
-
149
-
150
-
151
-
152
-
153
-
154
-
155
-
156
-
157
-
158
-
159
-
160
-
161
-
162
-
163
-
164
-
165
-
166
-
167
-
168
-
169
-
170
-
171
-
172
-
173
-
174
-
175
-
176
-
177
-
178
-
179
-
180
-
181
-
182
-
183
-
184
-
185
-
186
-
187
-
188
-
189
-
190
-
191
-
192
-
193
-
194
-
195
-
196
-
197
-
198
-
199
-
200
-
201
-
202
-
203
-
204
-
205
-
206
-
207
-
208
-
209
-
210
-
211
-
212
-
213
-
214
-
215
-
216
-
217
-
218
-
219
-
220
-
221
-
222
-
223
-
224
-
225
-
226
-
227
-
228
-
229
-
230
-
231
-
232
-
233
-
234
-
235
-
236
-
237
-
238
-
239
-
240
-
241
-
242
-
243
-
244
-
245
-
246
-
247
-
248
-
249
-
250
-
251
-
252
-
253
-
254
-
255
-
256
-
257
-
258
-
259
-
260
-
261
-
262
-
263
-
264
-
265
-
266
-
267
-
268
-
269
-
270
-
271
-
272
-
273
-
274
-
275
-
276
-
277
-
278
-
279
-
280
-
281
-
282
-
283
-
284
-
285
-
286
-
287
-
288
-
289
-
290
-
291
-
292
-
293
-
294
-
295
-
296
-
297
-
298
-
299
-
300
-
301
-
302
-
303
-
304
-
305
-
306
-
307
-
308
-
309
-
310
-
311
 |
 |

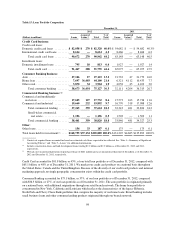
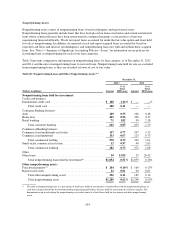
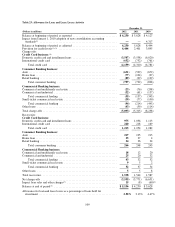
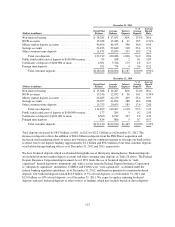
(2) The nonperforming loan ratio, excluding the impact of acquired loans from the denominator, for home loan, retail banking, total
consumer banking, commercial and multifamily real estate, commercial and industrial, total commercial banking and total
nonperforming loans held for investment was 5.48%, 1.83%, 1.66%, 0.78%, 0.68%, 0.73% and 0.62%, respectively, as of December 31,
2012, compared with 7.22%, 2.21%, 2.03%, 1.33%, 0.75%, 1.10% and 0.81%, respectively, as of December 31, 2011. The
nonperforming asset ratio, excluding acquired loans, was 0.76% and 0.95% as of December 31, 2012 and 2011, respectively.
(3) We recognized interest income for loans classified as nonperforming of $32 million and $31 million in 2012 and 2011, respectively.
Interest income foregone related to nonperforming loans was $41 million and $44 million in 2012 and 2011, respectively. Foregone
interest income represents the amount of interest income that would have been recorded during the period for nonperforming loans as of
the end of the period had the loans performed according to their contractual terms.
(4) Nonperforming loans as a percentage of loans held for investment, excluding credit card loans from the denominator, was 0.92% and
1.50% as of December 31, 2012 and 2011, respectively.
(5) Includes foreclosed properties related to acquired loans of $167 million and $86 million as of December 31, 2012 and 2011, respectively.
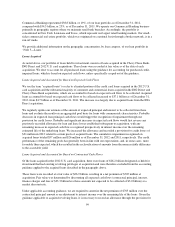
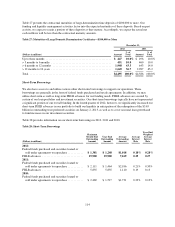
Nonperforming loans included troubled debt restructurings (“TDRs”) of $375 million and $170 million as of
December 31, 2012 and 2011, respectively. While the amount of nonperforming loans of $1.1 billion as of
December 31, 2012 was unchanged from December 31, 2011, the nonperforming loan ratio decreased to 0.51%
as of December 31, 2012, from 0.78% as of December 31, 2011. The decrease was primarily attributable to the
addition of the ING Direct acquired loans accounted for based on expected cash flows, as well as the
improvement in the credit quality of our commercial banking loans.
Net Charge-Offs
Net charge-offs consist of the unpaid principal balance of loans held for investment that we determine are
uncollectible, net of recovered amounts. We exclude accrued and unpaid finance charges and fees and fraud
losses from charge-offs. Charge-offs are recorded as a reduction to the allowance for loan and lease losses and
subsequent recoveries of previously charged off amounts are credited to the allowance for loan and lease losses.
Costs incurred to recover charged-off loans are recorded as collection expense and included in our consolidated
statements of income as a component of other non-interest expense. Our charge-off time frame for loans varies
based on the loan type. See “Note 1—Summary of Significant Accounting Policies—Loans” for information on
our charge-off policy for each of our loan categories.
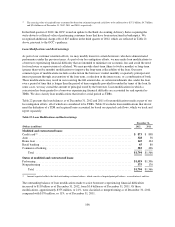
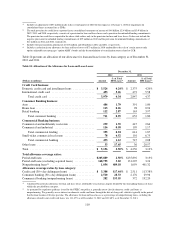
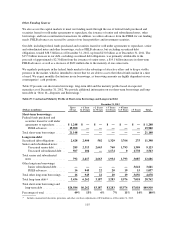
Table 21 presents our net charge-off amounts and rates, by business segment, for 2012, 2011 and 2010. We
provide information on charge-off amounts by loan category below in Table 22.
Table 21: Net Charge-Offs
(Dollars in millions)
December 31,
2012 2011 2010
Amount Rate(1)
Adjusted
Rate(2) Amount Rate(1)
Adjusted
Rate(2) Amount Rate(1)
Adjusted
Rate(2)
Credit card ......... $ 2,944 3.68% 3.69% $ 3,056 4.92% 4.92% $ 5,505 8.79% 8.79%
Consumer banking . . . 531 0.74 1.45 484 1.39 1.59 655 1.82 2.17
Commercial
banking .......... 42 0.12 0.12 177 0.57 0.58 391 1.31 1.34
Other ............. 38 24.14 24.57 54 25.96 25.96 106 37.80 37.80
Total .............. $ 3,555 1.89% 2.34% $ 3,771 2.94% 3.06% $ 6,657 5.18% 5.45%
Average loans held for
investment ....... $187,915 $128,424 $128,622
Average loans held for
investment
(excluding acquired
loans)(3) .......... 151,668 123,416 122,228
(1) Calculated for each loan category by dividing net charge-offs for the period by average loans held for investment during the period.
(2) Calculated by excluding acquired loans accounted for based on estimated cash flows expected to be collected from the denominator.
105