Capital One 2012 Annual Report Download - page 196
Download and view the complete annual report
Please find page 196 of the 2012 Capital One annual report below. You can navigate through the pages in the report by either clicking on the pages listed below, or by using the keyword search tool below to find specific information within the annual report.-
 1
1 -
2
-
3
-
4
-
5
-
6
-
7
-
8
-
9
-
10
-
11
-
12
-
13
-
14
-
15
-
16
-
17
-
18
-
19
-
20
-
21
-
22
-
23
-
24
-
25
-
26
-
27
-
28
-
29
-
30
-
31
-
32
-
33
-
34
-
35
-
36
-
37
-
38
-
39
-
40
-
41
-
42
-
43
-
44
-
45
-
46
-
47
-
48
-
49
-
50
-
51
-
52
-
53
-
54
-
55
-
56
-
57
-
58
-
59
-
60
-
61
-
62
-
63
-
64
-
65
-
66
-
67
-
68
-
69
-
70
-
71
-
72
-
73
-
74
-
75
-
76
-
77
-
78
-
79
-
80
-
81
-
82
-
83
-
84
-
85
-
86
-
87
-
88
-
89
-
90
-
91
-
92
-
93
-
94
-
95
-
96
-
97
-
98
-
99
-
100
-
101
-
102
-
103
-
104
-
105
-
106
-
107
-
108
-
109
-
110
-
111
-
112
-
113
-
114
-
115
-
116
-
117
-
118
-
119
-
120
-
121
-
122
-
123
-
124
-
125
-
126
-
127
-
128
-
129
-
130
-
131
-
132
-
133
-
134
-
135
-
136
-
137
-
138
-
139
-
140
-
141
-
142
-
143
-
144
-
145
-
146
-
147
-
148
-
149
-
150
-
151
-
152
-
153
-
154
-
155
-
156
-
157
-
158
-
159
-
160
-
161
-
162
-
163
-
164
-
165
-
166
-
167
-
168
-
169
-
170
-
171
-
172
-
173
-
174
-
175
-
176
-
177
-
178
-
179
-
180
-
181
-
182
-
183
-
184
-
185
-
 186
186 -
 187
187 -
 188
188 -
 189
189 -
 190
190 -
 191
191 -
 192
192 -
 193
193 -
 194
194 -
 195
195 -
 196
196 -
 197
197 -
 198
198 -
 199
199 -
 200
200 -
 201
201 -
 202
202 -
 203
203 -
 204
204 -
 205
205 -
 206
206 -
207
-
208
-
209
-
210
-
211
-
212
-
213
-
214
-
215
-
216
-
217
-
218
-
219
-
220
-
221
-
222
-
223
-
224
-
225
-
226
-
227
-
228
-
229
-
230
-
231
-
232
-
233
-
234
-
235
-
236
-
237
-
238
-
239
-
240
-
241
-
242
-
243
-
244
-
245
-
246
-
247
-
248
-
249
-
250
-
251
-
252
-
253
-
254
-
255
-
256
-
257
-
258
-
259
-
260
-
261
-
262
-
263
-
264
-
265
-
266
-
267
-
268
-
269
-
270
-
271
-
272
-
273
-
274
-
275
-
276
-
277
-
278
-
279
-
280
-
281
-
282
-
283
-
284
-
285
-
286
-
287
-
288
-
289
-
290
-
291
-
292
-
293
-
294
-
295
-
296
-
297
-
298
-
299
-
300
-
301
-
302
-
303
-
304
-
305
-
306
-
307
-
308
-
309
-
310
-
311
 |
 |

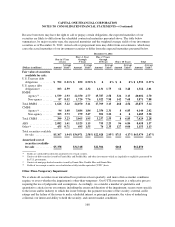
CAPITAL ONE FINANCIAL CORPORATION
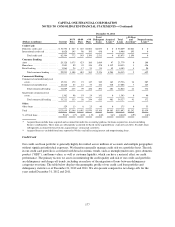
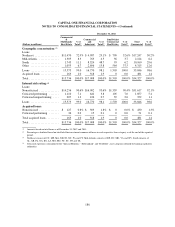
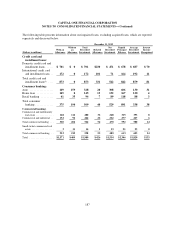
NOTES TO CONSOLIDATED FINANCIAL STATEMENTS—(Continued)
December 31, 2011
(Dollars in millions) Current
30-59
Days
60-89
Days
> 90
Days
Total
Delinquent
Loans
Acquired
Loans(1)
Total
Loans
> 90 Days
and
Accruing(2)
Nonperforming
Loans(2)
Credit Card:
Domestic credit card ............. $ 54,536 $ 627 $ 445 $1,001 $2,073 $ 0 $ 56,609 $1,001 $ 0
International credit card ........... 8,028 145 98 195 438 0 8,466 195 0
Total credit card ............. 62,564 772 543 1,196 2,511 0 65,075 1,196 0
Consumer Banking:
Auto .......................... 20,128 1,075 423 106 1,604 47 21,779 0 106
Home loan ..................... 5,843 89 43 346 478 4,112 10,433 1 456
Retail banking .................. 3,964 24 17 53 94 45 4,103 4 90
Total consumer banking ....... 29,935 1,188 483 505 2,176 4,204 36,315 5 652
Commercial Banking:
Commercial and multifamily real
estate ........................ 15,231 172 23 147 342 163 15,736 34 207
Commercial and industrial ......... 16,618 63 16 73 152 318 17,088 7 125
Total commercial lending ..... 31,849 235 39 220 494 481 32,824 41 332
Small-ticket commercial real
estate ........................ 1,362 98 19 24 141 0 1,503 0 40
Total commercial banking ..... 33,211 333 58 244 635 481 34,327 41 372
Other:
Other loans ..................... 129 13 8 25 46 0 175 0 35
Total .......................... $125,839 $2,306 $1,092 $1,970 $5,368 $4,685 $135,892 $1,242 $1,059
% of Total loans ................. 92.6% 1.7% 0.8% 1.5% 4.0% 3.4% 100.0% 0.9% 0.8%
(1) Acquired loans include loans acquired and accounted for under the accounting guidance for loans acquired in a transfer including
business combinations. These loans are subsequently accounted for based on the acquired loans’ expected cash flows. Excludes loans
subsequently accounted for based on the acquired loans’ contractual cash flows.
(2) Acquired loans are excluded from loans reported as 90 days and still accruing interest and nonperforming loans.
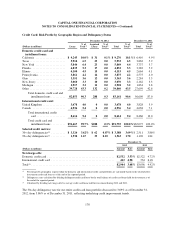
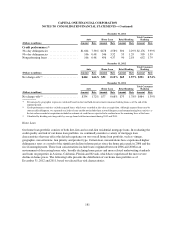
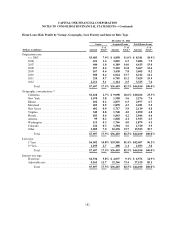
Credit Card
Our credit card loan portfolio is generally highly diversified across millions of accounts and multiple geographies
without significant individual exposures. We therefore generally manage credit risk on a portfolio basis. The risk
in our credit card portfolio is correlated with broad economic trends, such as unemployment rates, gross domestic
product (“GDP”), and home values, as well as customer liquidity, which can have a material effect on credit
performance. The primary factors we assess in monitoring the credit quality and risk of our credit card portfolio
are delinquency and charge-off trends, including an analysis of the migration of loans between delinquency
categories over time. The table below displays the geographic profile of our credit card loan portfolio and
delinquency statistics as of December 31, 2012 and 2011. We also present comparative net charge-offs for the
years ended December 31, 2012 and 2011.
177